Experian 2014 Annual Report Download - page 91
Download and view the complete annual report
Please find page 91 of the 2014 Experian annual report below. You can navigate through the pages in the report by either clicking on the pages listed below, or by using the keyword search tool below to find specific information within the annual report.-
 1
1 -
2
-
3
-
4
-
5
-
6
-
7
-
8
-
9
-
10
-
11
-
12
-
13
-
14
-
15
-
16
-
17
-
18
-
19
-
20
-
21
-
22
-
23
-
24
-
25
-
26
-
27
-
28
-
29
-
30
-
31
-
32
-
33
-
34
-
35
-
36
-
37
-
38
-
39
-
40
-
41
-
42
-
43
-
44
-
45
-
46
-
47
-
48
-
49
-
50
-
51
-
52
-
53
-
54
-
55
-
56
-
57
-
58
-
59
-
60
-
61
-
62
-
63
-
64
-
65
-
66
-
67
-
68
-
69
-
70
-
71
-
72
-
73
-
74
-
75
-
76
-
77
-
78
-
79
-
80
-
 81
81 -
 82
82 -
 83
83 -
 84
84 -
 85
85 -
 86
86 -
 87
87 -
 88
88 -
 89
89 -
 90
90 -
 91
91 -
 92
92 -
 93
93 -
 94
94 -
 95
95 -
 96
96 -
 97
97 -
 98
98 -
 99
99 -
 100
100 -
 101
101 -
102
-
103
-
104
-
105
-
106
-
107
-
108
-
109
-
110
-
111
-
112
-
113
-
114
-
115
-
116
-
117
-
118
-
119
-
120
-
121
-
122
-
123
-
124
-
125
-
126
-
127
-
128
-
129
-
130
-
131
-
132
-
133
-
134
-
135
-
136
-
137
-
138
-
139
-
140
-
141
-
142
-
143
-
144
-
145
-
146
-
147
-
148
-
149
-
150
-
151
-
152
-
153
-
154
-
155
-
156
-
157
-
158
-
159
-
160
-
161
-
162
-
163
-
164
-
165
-
166
-
167
-
168
-
169
-
170
-
171
-
172
-
173
-
174
-
175
-
176
-
177
-
178
 |
 |

87
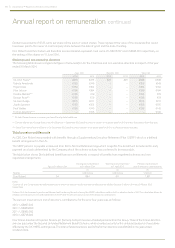
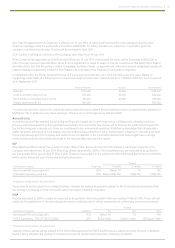
Additional requirements in respect of the single total figure of remuneration
Performance against annual bonus targets
The Committee set targets for the annual bonus based on profit growth in respect of the year ended 31 March 2014, which required
stretching levels of performance to earn the maximum bonus. The Committee considered a profit growth metric to be appropriate as
it reflects one of Experian’s key performance indicators (EBIT).
The Benchmark PBT growth, for bonus purposes, of 8%, was at the target level of the performance range. Accordingly, a bonus
equivalent to 100% of salary (as against a maximum of 200%) is payable to the executive directors.
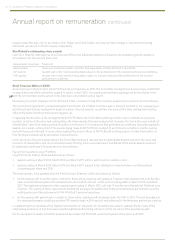
The Committee considers that this level of bonus payment is appropriate in the context of the underlying performance of the Group.
The Committee has not disclosed the annual bonus target calibration for the year ended 31 March 2014 as this continues to be
considered commercially sensitive. Whilst we acknowledge that shareholders would like targets to be disclosed, the Committee
believes that this is not in shareholders’ longer-term interests given that it would be damaging to the Company and useful to our
competitors. If the Committee decides that targets have ceased to be commercially sensitive, they will be disclosed in the next
available remuneration report.
Don Robert and Brian Cassin have elected to defer 100% of their annual bonus for the year ended 31 March 2014 into the CIP.
Chris Callero is retiring as a director of the Company with effect from 16 July 2014.
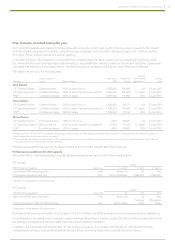
Vesting of share-based incentives
The amount included in the 2014 single total figure of remuneration is the combined value of the CIP and PSP awards granted in
2011. Vesting for both of these awards depended on performance over the three years ended 31 March 2014 and continued service
until 15 June 2014.
The performance achieved against the performance targets is shown in the following tables.
CIP awards
Performance measure Weighting
Vesting*
Actual
Percentage
vesting No match 1:1 match 2:1 match
Benchmark PBT (annual growth) 50% Below 7% 7% 14% 13.1% 46.8%
Cumulative operating cash flow 50%
Below
US$3.0bn US$3.0bn US$3.4bn US$3.6bn 50.0%
Total 96.8%
*Straight-line vesting between the points shown.
PSP awards
Performance measure Weighting
Vesting*
Actual
Percentage
vesting 0% 25% 100%
Benchmark PBT (annual growth) 75% Below 7% 7% 14% 13.1% 67.8%
TSR of Experian vs. TSR of FTSE 100 Index 25%
Below
Index
Equal
to Index
25% above
Index
18.8% above
Index 20.3%
Total 8 8.1%
*Straight-line vesting between the points shown.
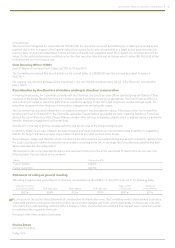
PSP awards will also only vest where, in the judgment of the Committee, the return on capital employed (‘ROCE’) performance over
the period has been satisfactory.
As these awards had not vested at the date this report was finalised, the value of the awards is based on the average share price
of the last three months of the financial year, which was £10.83. The value of the awards, as included in the single total figure of
remuneration, is as follows.
Participant
CIP PSP Value of
shares
vesting*
Shares
awarded
Shares
vesting
Shares
awarded
Shares
vesting
Don Robert 443,046 428,868 233,006 205,278 US$11.373m
Chris Callero 284,160 275,066 149,124 131,378 US$7.289m
*The value of the shares has been converted into US dollars at a rate of £1:US$1.66, which is the average rate over the last three months of the financial year.
Governance • Report on directors’ remuneration