Experian 2014 Annual Report Download - page 154
Download and view the complete annual report
Please find page 154 of the 2014 Experian annual report below. You can navigate through the pages in the report by either clicking on the pages listed below, or by using the keyword search tool below to find specific information within the annual report.-
 1
1 -
2
-
3
-
4
-
5
-
6
-
7
-
8
-
9
-
10
-
11
-
12
-
13
-
14
-
15
-
16
-
17
-
18
-
19
-
20
-
21
-
22
-
23
-
24
-
25
-
26
-
27
-
28
-
29
-
30
-
31
-
32
-
33
-
34
-
35
-
36
-
37
-
38
-
39
-
40
-
41
-
42
-
43
-
44
-
45
-
46
-
47
-
48
-
49
-
50
-
51
-
52
-
53
-
54
-
55
-
56
-
57
-
58
-
59
-
60
-
61
-
62
-
63
-
64
-
65
-
66
-
67
-
68
-
69
-
70
-
71
-
72
-
73
-
74
-
75
-
76
-
77
-
78
-
79
-
80
-
81
-
82
-
83
-
84
-
85
-
86
-
87
-
88
-
89
-
90
-
91
-
92
-
93
-
94
-
95
-
96
-
97
-
98
-
99
-
100
-
101
-
102
-
103
-
104
-
105
-
106
-
107
-
108
-
109
-
110
-
111
-
112
-
113
-
114
-
115
-
116
-
117
-
118
-
119
-
120
-
121
-
122
-
123
-
124
-
125
-
126
-
127
-
128
-
129
-
130
-
131
-
132
-
133
-
134
-
135
-
136
-
137
-
138
-
139
-
140
-
141
-
142
-
143
-
 144
144 -
 145
145 -
 146
146 -
 147
147 -
 148
148 -
 149
149 -
 150
150 -
 151
151 -
 152
152 -
 153
153 -
 154
154 -
 155
155 -
 156
156 -
 157
157 -
 158
158 -
 159
159 -
 160
160 -
 161
161 -
 162
162 -
 163
163 -
 164
164 -
165
-
166
-
167
-
168
-
169
-
170
-
171
-
172
-
173
-
174
-
175
-
176
-
177
-
178
 |
 |

Financial statements • Notes to the Group financial statements
Notes to the Group financial statements
for the year ended 31 March 2014 continued
150
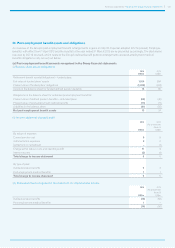
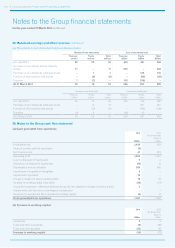
34. Post-employment benefit assets and obligations continued
(b) Movements in net post-employment benefit assets recognised in the balance sheet
Fair value of
plan assets
US$m
Present value of obligations Net post-
employment
benefit assets
US$m
Defined
pension
benefits –
funded
US$m
Defined
pension
benefits –
unfunded
US$m
Post-
employment
medical
benefits
US$m
Total
US$m
At 1 April 2013 994 (914) (45) (11) (970) 24
Income statement (charge)/credit:
Current service cost – (8) (1) – (9) (9)
Administration expenses – (2) – – (2) (2)
Interest income/(expense) 46 (42) (2) – (44) 2
Total (charge)/credit to income statement 46 (52) (3) – (55) (9)
Remeasurements:
Return on plan assets other than interest (2) – – – – (2)
Gains/(losses) from change in
demographic assumptions – (17) (1) (1) (19) (19)
Gains/(losses) from change in
financial assumptions – 8 – – 8 8
Experience gains/(losses) – (4) 1 2 (1) (1)
Remeasurement of post-employment benefit
assets and obligations (2) (13) – 1 (12) (14)
Differences on exchange 96 (90) (3) (1) (94) 2
Contributions paid by the Group 7 – 2 1 3 10
Contributions paid by employees 3 (3) – – (3) –
Benefits paid (40) 42 (1) (1) 40 –
At 31 March 2014 1,104 (1,030) (50) (11) (1,091) 13
Fair value of
plan assets
US$m
Present value of obligations Net post-
employment
benefit assets
US$m
Defined
pension
benefits –
funded
US$m
Defined
pension
benefits –
unfunded
US$m
Post-
employment
medical
benefits
US$m
Total
US$m
At 1 April 2012 957 (827) (41) (12) (880) 77
Income statement (charge)/credit:
Current service cost – (8) – – (8) (8)
Administration expenses –(2) – – (2) (2)
Settlement or curtailment – 1 – – 1 1
Interest income/(expense) 48 (41) (2) (1) (44) 4
Total (charge)/credit to income statement 48 (50) (2) (1) (53) (5)
Remeasurements:
Return on plan assets other than interest 72 – – – – 72
Gains/(losses) from change in financial
assumptions – (128) – – (128) (128)
Experience gains/(losses) – – – – – –
Remeasurement of post-employment benefit
assets and obligations 72 (128) – – (128) (56)
Differences on exchange (52) 50 (2) 1 49 (3)
Contributions paid by the Group 11 – – – – 11
Contributions paid by employees 3 (3) – – (3) –
Benefits paid (45) 44 – 1 45 –
At 31 March 2013 994 (914) (45) (11) (970) 24