Experian 2014 Annual Report Download - page 48
Download and view the complete annual report
Please find page 48 of the 2014 Experian annual report below. You can navigate through the pages in the report by either clicking on the pages listed below, or by using the keyword search tool below to find specific information within the annual report.-
 1
1 -
2
-
3
-
4
-
5
-
6
-
7
-
8
-
9
-
10
-
11
-
12
-
13
-
14
-
15
-
16
-
17
-
18
-
19
-
20
-
21
-
22
-
23
-
24
-
25
-
26
-
27
-
28
-
29
-
30
-
31
-
32
-
33
-
34
-
35
-
36
-
37
-
 38
38 -
 39
39 -
 40
40 -
 41
41 -
 42
42 -
 43
43 -
 44
44 -
 45
45 -
 46
46 -
 47
47 -
 48
48 -
 49
49 -
 50
50 -
 51
51 -
 52
52 -
 53
53 -
 54
54 -
 55
55 -
 56
56 -
 57
57 -
 58
58 -
59
-
60
-
61
-
62
-
63
-
64
-
65
-
66
-
67
-
68
-
69
-
70
-
71
-
72
-
73
-
74
-
75
-
76
-
77
-
78
-
79
-
80
-
81
-
82
-
83
-
84
-
85
-
86
-
87
-
88
-
89
-
90
-
91
-
92
-
93
-
94
-
95
-
96
-
97
-
98
-
99
-
100
-
101
-
102
-
103
-
104
-
105
-
106
-
107
-
108
-
109
-
110
-
111
-
112
-
113
-
114
-
115
-
116
-
117
-
118
-
119
-
120
-
121
-
122
-
123
-
124
-
125
-
126
-
127
-
128
-
129
-
130
-
131
-
132
-
133
-
134
-
135
-
136
-
137
-
138
-
139
-
140
-
141
-
142
-
143
-
144
-
145
-
146
-
147
-
148
-
149
-
150
-
151
-
152
-
153
-
154
-
155
-
156
-
157
-
158
-
159
-
160
-
161
-
162
-
163
-
164
-
165
-
166
-
167
-
168
-
169
-
170
-
171
-
172
-
173
-
174
-
175
-
176
-
177
-
178
 |
 |

44 Strategic report • Financial review
Financial review continued
Exchange rate movements from last
year have decreased our reported
revenue for the year ended 31 March 2014
by US$107m and our EBIT by US$39m.
This is primarily as a consequence of
the weakness of the Brazilian real and
its impact on the reported results of our
Latin America region.
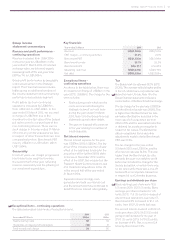
Group cash flow commentary
Cash flow summary
We generated very strong cash flow
in the year with operating cash flow of
US$1,321m (2013: US$1,175m) and a
cash flow conversion of 101% (2013: 94%).
We manage working capital and capital
expenditure with the aim of converting at
least 90% of our EBIT into operating cash
flow. This target is a key performance
indicator and our five-year track record for
this metric is shown in that section of the
Strategic report. Note 39(i) to the Group
financial statements reconciles cash
generated from operations, as reported
in the Group cash flow statement, to
operating cash flow as reported in the
cash flow summary table.
As the cash flow summary table shows,
free cash flow in the year ended 31
March 2014 was US$1,067m (2013:
US$891m). The net cash outflow in the
year of US$570m (2013: US$1,018m) is
after acquisition spend of US$1,250m
(2013: US$1,549m) and equity dividend
payments of US$349m (2013: US$322m).
Note 39(e) to the Group financial
statements analyses our acquisition
spend. Acquisitions in the year ended
31 March 2014 included the two
significant transactions in North America.
Acquisition spend in the prior year
principally comprised the additional
stake in Serasa in November 2012. The
Group ran a share purchase programme
from May 2013 until late October 2013,
when it was discontinued following the
announcement of the acquisition of
Passport Health Communications.
Funding
In light of the above and our redemption
of the £334m 5.625% Euronotes 2013 at
maturity in December 2013, we
undertook two significant corporate
financing initiatives in the second half
of the year. We initiated a commercial
paper programme in January 2014 and
we issued £400m 3.50% Euronotes 2021
in February 2014.
Both these initiatives were well
supported by the financial markets.
Our outstandings under the commercial
paper programme were US$576m at
31 March 2014.
Capital expenditure
Capital expenditure was US$402m (2013:
US$460m) including data and software
to support our future growth. An
analysis of our expenditure by operating
segment is given in note 9(a)(iii) to the
Group financial statements. Later in this
review we provide a chart comparing
capital expenditure to amortisation and
depreciation charges in each of the two
years ended 31 March 2014.
We subject our capital expenditure
to rigorous internal review processes
on both a pre-investment and a post-
investment view. We have reduced capital
expenditure as a percentage of revenue
from 9.7% in the prior year to 8.3% in the
year under review.
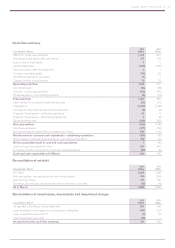
Net debt and covenants
At 31 March 2014, net debt was
US$3,809m (2013: US$2,938m) with
undrawn committed borrowing facilities
of US$2,216m (2013: US$1,624m). Our
net debt at 31 March 2014 was 2.27 times
EBITDA, compared to a target ratio of 1.75
to 2.0 times.
A summary reconciliation of the movement
in net debt is provided below and a more
detailed reconciliation is included in note
27(c) to the Group financial statements.
Note 26(b) to the Group financial
statements shows the maturity profile
of our borrowings and facilities.
We have not breached any covenants
given on borrowings in the year under
review or the prior year and have no
undue concentration of repayment
obligations in respect of borrowings.
Foreign exchange – average rates
The principal exchange rates used to translate revenue and EBIT are shown in the
table below.
At 31 March
2014 2013 Changed
against the US$
US$ : Brazilian real 2.25 2.01 (11.9%)
Sterling : US$ 1.59 1.58 0.6%
Euro : US$ 1.34 1.29 3.9%
P157
P158
P141
P123
P140