Experian 2014 Annual Report Download - page 95
Download and view the complete annual report
Please find page 95 of the 2014 Experian annual report below. You can navigate through the pages in the report by either clicking on the pages listed below, or by using the keyword search tool below to find specific information within the annual report.-
 1
1 -
2
-
3
-
4
-
5
-
6
-
7
-
8
-
9
-
10
-
11
-
12
-
13
-
14
-
15
-
16
-
17
-
18
-
19
-
20
-
21
-
22
-
23
-
24
-
25
-
26
-
27
-
28
-
29
-
30
-
31
-
32
-
33
-
34
-
35
-
36
-
37
-
38
-
39
-
40
-
41
-
42
-
43
-
44
-
45
-
46
-
47
-
48
-
49
-
50
-
51
-
52
-
53
-
54
-
55
-
56
-
57
-
58
-
59
-
60
-
61
-
62
-
63
-
64
-
65
-
66
-
67
-
68
-
69
-
70
-
71
-
72
-
73
-
74
-
75
-
76
-
77
-
78
-
79
-
80
-
81
-
82
-
83
-
84
-
 85
85 -
 86
86 -
 87
87 -
 88
88 -
 89
89 -
 90
90 -
 91
91 -
 92
92 -
 93
93 -
 94
94 -
 95
95 -
 96
96 -
 97
97 -
 98
98 -
 99
99 -
 100
100 -
 101
101 -
 102
102 -
 103
103 -
 104
104 -
 105
105 -
106
-
107
-
108
-
109
-
110
-
111
-
112
-
113
-
114
-
115
-
116
-
117
-
118
-
119
-
120
-
121
-
122
-
123
-
124
-
125
-
126
-
127
-
128
-
129
-
130
-
131
-
132
-
133
-
134
-
135
-
136
-
137
-
138
-
139
-
140
-
141
-
142
-
143
-
144
-
145
-
146
-
147
-
148
-
149
-
150
-
151
-
152
-
153
-
154
-
155
-
156
-
157
-
158
-
159
-
160
-
161
-
162
-
163
-
164
-
165
-
166
-
167
-
168
-
169
-
170
-
171
-
172
-
173
-
174
-
175
-
176
-
177
-
178
 |
 |

91
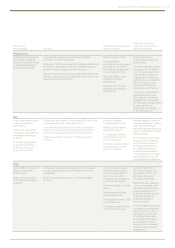
(3) Except for 100,799 unvested shares awarded to Brian Cassin on 18 May 2012 as replacement awards for outstanding equity awards from his previous employer, all
awards under the PSP are subject to performance conditions, as follows:
Benchmark PBT growth (75% of an award)
Vesting*
0% 25% 100%
2011 Below 7% 7% 14%
2012 Below 7% 7% 14%
2013 Below 7% 7% 14%
* Straight-line vesting between the points shown.
TSR vs. FTSE 100 – % outperformance
(25% of an award)
Vesting*
0% 25% 100%
2011 Below Index Equal to Index 25% above Index
2012 Below Index Equal to Index 25% above Index
2013 Below Index Equal to Index 25% above Index
* Straight-line vesting between the points shown.
All outstanding awards are also subject to a ROCE performance underpin and a clawback feature whereby the vesting of awards
is subject to the Committee being satisfied that the vesting is not based on financial results which have been materially misstated.
(4) Shareholding guidelines have been calculated using the closing exchange rates at 31 March 2014 of £1:US$1.66 and £1:€1.21.
(5) The number of Experian shares held by Don Robert and Chris Callero at 31 March 2014 includes 559,510 and 358,229 shares respectively awarded to them under
the Experian North America Co-investment Plan in lieu of annual bonus, in addition to their personal beneficial shareholding. Don Robert and Chris Callero have
an unconditional right to receive these Experian shares at the end of the relevant three-year deferral period. These shares do not carry dividend or voting rights
prior to receipt.
(6) Don Robert was granted 132,091 options with an exercise price of £4.83 on 31 March 2005 and which are exercisable between 31 May 2008 and 30 May 2015 when they
lapse. On 2 June 2006, he was granted 133,184 options with an exercise price of £5.21, which are exercisable between 2 June 2009 and 1 June 2016 when they lapse.
(7) The number of Experian shares held by Brian Cassin at 31 March 2014 includes 29,947 invested shares in the Co-investment Plan.
(8) As a result of the increase in NED fees during the year, the value of Deirdre Mahlan’s shareholding at 31 March 2014 is slightly under the shareholding guideline. This
will be reviewed again at the time of payment of the fee in June 2014 and this will be used to purchase further shares, if necessary, at that time.
Executive directors’ non-executive directorships
Don Robert served as a non-executive director of Compass Group plc during the period under review, for which he received a fee of
£81,000 (2013: £81,000).
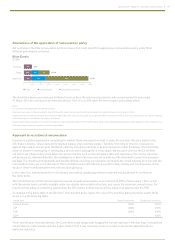
Performance graph and table (not audited)
The chart below shows Experian’s five-year annual TSR performance against the FTSE 100 Index. The FTSE 100 Index is the most
appropriate index against which TSR should be measured, as it is widely used and understood and is an index of which Experian is
a constituent.
Experian FTSE 100 Index
Value of
£
100
invested in Experian and the FTSE
100
on
31
March
2009
300
250
100
150
200
March 09 March 11 March 13March 10 March 12 March 14
Governance • Report on directors’ remuneration