Experian 2014 Annual Report Download - page 37
Download and view the complete annual report
Please find page 37 of the 2014 Experian annual report below. You can navigate through the pages in the report by either clicking on the pages listed below, or by using the keyword search tool below to find specific information within the annual report.-
 1
1 -
2
-
3
-
4
-
5
-
6
-
7
-
8
-
9
-
10
-
11
-
12
-
13
-
14
-
15
-
16
-
17
-
18
-
19
-
20
-
21
-
22
-
23
-
24
-
25
-
26
-
 27
27 -
 28
28 -
 29
29 -
 30
30 -
 31
31 -
 32
32 -
 33
33 -
 34
34 -
 35
35 -
 36
36 -
 37
37 -
 38
38 -
 39
39 -
 40
40 -
 41
41 -
 42
42 -
 43
43 -
 44
44 -
 45
45 -
 46
46 -
 47
47 -
48
-
49
-
50
-
51
-
52
-
53
-
54
-
55
-
56
-
57
-
58
-
59
-
60
-
61
-
62
-
63
-
64
-
65
-
66
-
67
-
68
-
69
-
70
-
71
-
72
-
73
-
74
-
75
-
76
-
77
-
78
-
79
-
80
-
81
-
82
-
83
-
84
-
85
-
86
-
87
-
88
-
89
-
90
-
91
-
92
-
93
-
94
-
95
-
96
-
97
-
98
-
99
-
100
-
101
-
102
-
103
-
104
-
105
-
106
-
107
-
108
-
109
-
110
-
111
-
112
-
113
-
114
-
115
-
116
-
117
-
118
-
119
-
120
-
121
-
122
-
123
-
124
-
125
-
126
-
127
-
128
-
129
-
130
-
131
-
132
-
133
-
134
-
135
-
136
-
137
-
138
-
139
-
140
-
141
-
142
-
143
-
144
-
145
-
146
-
147
-
148
-
149
-
150
-
151
-
152
-
153
-
154
-
155
-
156
-
157
-
158
-
159
-
160
-
161
-
162
-
163
-
164
-
165
-
166
-
167
-
168
-
169
-
170
-
171
-
172
-
173
-
174
-
175
-
176
-
177
-
178
 |
 |

33
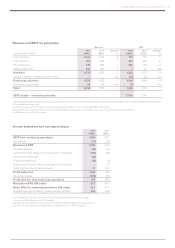
Revenue and EBIT by geography
Year ended 31 March
Revenue EBIT
2014
US$m
20131
US$m
Growth2
%
2014
US$m
20131
US$m
Growth2
%
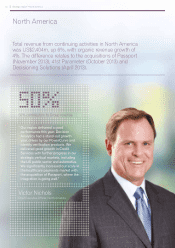
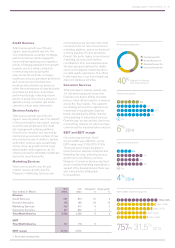
North America 2,404 2,258 6757 718 5
Latin America 925 960 7344 343 12
UK and Ireland 944 873 7284 246 14
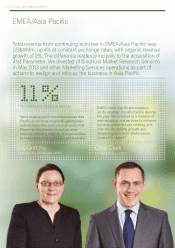
EMEA/Asia Pacific 499 491 4720 (60)
Sub-total 4,772 4,582 71,392 1,327 8
Central Activities - central corporate costs ––n/a (83) (83) n/a
Continuing activities 4,772 4,582 71,309 1,244 8
Discontinuing activities368 148 n/a (3) 7n/a
Tot al 4,840 4,730 51,306 1,251 7
EBIT margin – continuing activities 27.4% 27.1%
1. 2013 restated for the movement of some small businesses in Latin America and EMEA/Asia Pacific to discontinuing activities and for further costs within Central Activities.
2. At constant exchange rates.
3. Discontinuing activities comprise small discontinuing businesses in Latin America and EMEA/Asia Pacific.
See the Financial review for analysis of revenue, EBIT and EBIT margin by business segment and note 7 to the Group financial statements
for definitions of non-GAAP measures.
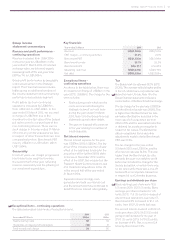
Income statement and earnings analysis
2014
US$m
20131
US$m
EBIT from continuing operations 1,306 1,251
Net interest (74) (62)
Benchmark PBT 1,232 1,189
Exceptional items (54) (66)
Amortisation and impairment of acquisition intangibles (131) (123)
Impairment of goodwill (15) –
Acquisition expenses (10) (4)
Adjustment to the fair value of contingent consideration –(1)
Financing fair value remeasurements 27 (561)
Profit before tax 1,049 434
Group tax charge (302) (151)
Profit after tax from continuing operations 747 283
Benchmark EPS (US cents) 91.7 85.2
Basic EPS for continuing operations (US cents) 76.1 24.7
Weighted average number of ordinary shares (million) 980 988
1. 2013 restated for further costs within Central Activities and a higher interest charge
as a result of the adoption of IAS 19 (revised).
See the Financial review for analysis of revenue, EBIT and EBIT margin by business segment
and note 7 to the Group financial statements for definitions of non-GAAP measures.
Strategic report • Chief Executive’s statement