Experian 2014 Annual Report Download - page 54
Download and view the complete annual report
Please find page 54 of the 2014 Experian annual report below. You can navigate through the pages in the report by either clicking on the pages listed below, or by using the keyword search tool below to find specific information within the annual report.-
 1
1 -
2
-
3
-
4
-
5
-
6
-
7
-
8
-
9
-
10
-
11
-
12
-
13
-
14
-
15
-
16
-
17
-
18
-
19
-
20
-
21
-
22
-
23
-
24
-
25
-
26
-
27
-
28
-
29
-
30
-
31
-
32
-
33
-
34
-
35
-
36
-
37
-
38
-
39
-
40
-
41
-
42
-
43
-
 44
44 -
 45
45 -
 46
46 -
 47
47 -
 48
48 -
 49
49 -
 50
50 -
 51
51 -
 52
52 -
 53
53 -
 54
54 -
 55
55 -
 56
56 -
 57
57 -
 58
58 -
 59
59 -
 60
60 -
 61
61 -
 62
62 -
 63
63 -
 64
64 -
65
-
66
-
67
-
68
-
69
-
70
-
71
-
72
-
73
-
74
-
75
-
76
-
77
-
78
-
79
-
80
-
81
-
82
-
83
-
84
-
85
-
86
-
87
-
88
-
89
-
90
-
91
-
92
-
93
-
94
-
95
-
96
-
97
-
98
-
99
-
100
-
101
-
102
-
103
-
104
-
105
-
106
-
107
-
108
-
109
-
110
-
111
-
112
-
113
-
114
-
115
-
116
-
117
-
118
-
119
-
120
-
121
-
122
-
123
-
124
-
125
-
126
-
127
-
128
-
129
-
130
-
131
-
132
-
133
-
134
-
135
-
136
-
137
-
138
-
139
-
140
-
141
-
142
-
143
-
144
-
145
-
146
-
147
-
148
-
149
-
150
-
151
-
152
-
153
-
154
-
155
-
156
-
157
-
158
-
159
-
160
-
161
-
162
-
163
-
164
-
165
-
166
-
167
-
168
-
169
-
170
-
171
-
172
-
173
-
174
-
175
-
176
-
177
-
178
 |
 |

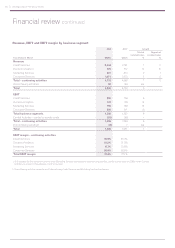
50 Strategic report • Financial review
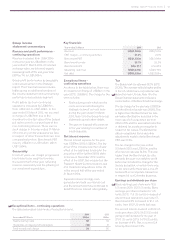
Revenue, EBIT and EBIT margin by business segment
Year ended 31 March
2014
US$m
20131
US$m
Growth
Total at
constant rates
%
Organic at
constant rates
%
Revenue
Credit Services 2,244 2,181 7 5
Decision Analytics 576 512 14 10
Marketing Services 881 874 2 1
Consumer Services 1,071 1,015 5 5
Total – continuing activities 4,772 4,582 7 5
Discontinuing activities268 148 n/a
Tot al 4,840 4,730 5
EBIT
Credit Services 806 769 9
Decision Analytics 122 109 14
Marketing Services 156 138 13
Consumer Services 308 311 (1)
Total business segments 1,392 1,327 8
Central Activities – central corporate costs (83) (83) –
Total – continuing activities 1,309 1,244 8
Discontinuing activities2(3) 7n/a
Tot al 1,306 1,251 7
EBIT margin – continuing activities
Credit Services 35.9% 35.3%
Decision Analytics 21.2% 21.3%
Marketing Services 17.7% 15.8%
Consumer Services 28.8% 30.6%
Total EBIT margin 27.4% 27.1%
1. 2013 restated for the movement of some small Marketing Services businesses to discontinuing activities, and for further costs of US$2m within Central
Activities as a result of the adoption of IAS 19 (revised).
2. Discontinuing activities comprise small discontinuing Credit Services and Marketing Services businesses.
Financial review continued