Experian 2014 Annual Report Download - page 51
Download and view the complete annual report
Please find page 51 of the 2014 Experian annual report below. You can navigate through the pages in the report by either clicking on the pages listed below, or by using the keyword search tool below to find specific information within the annual report.-
 1
1 -
2
-
3
-
4
-
5
-
6
-
7
-
8
-
9
-
10
-
11
-
12
-
13
-
14
-
15
-
16
-
17
-
18
-
19
-
20
-
21
-
22
-
23
-
24
-
25
-
26
-
27
-
28
-
29
-
30
-
31
-
32
-
33
-
34
-
35
-
36
-
37
-
38
-
39
-
40
-
 41
41 -
 42
42 -
 43
43 -
 44
44 -
 45
45 -
 46
46 -
 47
47 -
 48
48 -
 49
49 -
 50
50 -
 51
51 -
 52
52 -
 53
53 -
 54
54 -
 55
55 -
 56
56 -
 57
57 -
 58
58 -
 59
59 -
 60
60 -
 61
61 -
62
-
63
-
64
-
65
-
66
-
67
-
68
-
69
-
70
-
71
-
72
-
73
-
74
-
75
-
76
-
77
-
78
-
79
-
80
-
81
-
82
-
83
-
84
-
85
-
86
-
87
-
88
-
89
-
90
-
91
-
92
-
93
-
94
-
95
-
96
-
97
-
98
-
99
-
100
-
101
-
102
-
103
-
104
-
105
-
106
-
107
-
108
-
109
-
110
-
111
-
112
-
113
-
114
-
115
-
116
-
117
-
118
-
119
-
120
-
121
-
122
-
123
-
124
-
125
-
126
-
127
-
128
-
129
-
130
-
131
-
132
-
133
-
134
-
135
-
136
-
137
-
138
-
139
-
140
-
141
-
142
-
143
-
144
-
145
-
146
-
147
-
148
-
149
-
150
-
151
-
152
-
153
-
154
-
155
-
156
-
157
-
158
-
159
-
160
-
161
-
162
-
163
-
164
-
165
-
166
-
167
-
168
-
169
-
170
-
171
-
172
-
173
-
174
-
175
-
176
-
177
-
178
 |
 |

47
Strategic report • Financial review
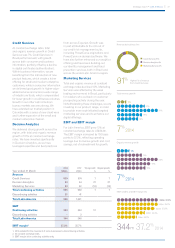
Share price and market capitalisation
Experian’s share price ranged from
£10.20 to £12.90 during the year. On
31 March 2014, the mid-market price
was £10.81, giving a market capitalisation
of US$18.5bn at that date.
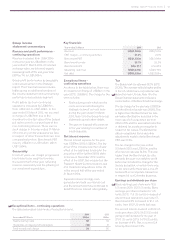
Accounting policies
and developments
The principal accounting policies are
shown in note 5 to the Group financial
statements and we have applied them
consistently. We support initiatives in
the UK financial reporting community
to ‘cut the clutter’ in published financial
statements. Accordingly we have adopted
this principle this year in preparing both
the Group and parent company financial
statements, while working within formats
that are broadly unchanged from earlier
annual reports.
The year under review has seen little
impact on the Group from developments
in accounting standards. Experian
adopted IAS 19 (revised) ‘Employee
benefits’ with effect from 1 April 2013 and
we have re-presented the comparative
information in this report as necessary.
Note 3 to the Group financial statements
gives further details and the impact of
adoption is modest.
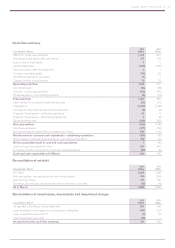
Accounting estimates and
assumptions
Note 6(a) to the Group financial
statements shows details of our critical
accounting estimates and assumptions.
The most significant of these relate to tax
and goodwill and the key features can be
summarised as follows:
• Estimates made in respect of tax
assets and liabilities include the
consideration of transactions in
the ordinary course of business for
which the ultimate tax determination
is uncertain.
• The assumptions used in the cash
flow projections underpinning the
impairment testing of goodwill
include assumptions about
profitability and future growth,
together with pre-tax discount
rates specific to the Group’s cash
generating units.
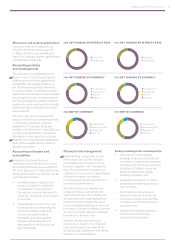
Financial risk management
The Protecting our business section
of this report sets out the risks and
uncertainties that are specific to our
business, together with more general
risks. Our financial risk management
continues to focus on the unpredictability
of financial markets and seeks to
minimise potentially adverse effects on
our financial performance.
We look to reduce our exposures to
foreign exchange, interest rate and
other financial risks. The mitigation of
our exposure to the unpredictability of
financial markets includes the use of
currency hedging strategies to minimise
the impact of currency volatility. However
we do not currently intend to undertake
borrowings in Brazilian real.
Detailed narrative and numerical
disclosures in respect of our financial
risks are included in the notes to the
Group financial statements, with the key
features summarised below.
Foreign exchange risk is managed by:
• entering into forward foreign
exchange contracts in the relevant
currencies in respect of investments
in entities with functional currencies
other than US dollars, whose net
assets are exposed to foreign
exchange translation risk;
• swapping the proceeds of certain
bonds issued in sterling and euros
into US dollars;
• denominating internal loans in
relevant currencies to match the
currencies of assets and liabilities
in entities with different functional
currencies; and
• using forward foreign exchange
contracts for certain future
commercial transactions.
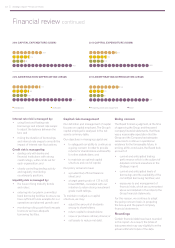
2014 NET FUNDING BY INTEREST RATE
2014 NET FUNDING BY CURRENCY
2014 EBIT BY CURRENCY
Fixed 77%
Floating 23%
Fixed 76%
Floating 24%
US dollar 81%
Sterling 17%
Euro 1%
Other 1%
US dollar 79%
Sterling 16%
Euro 1%
Other 4%
US dollar 56%
Brazilian real 24%
Sterling 13%
Other 7%
US dollar 57%
Brazilian real 26%
Sterling 10%
Other 7%
2013 NET FUNDING BY INTEREST RATE
2013 NET FUNDING BY CURRENCY
2013 EBIT BY CURRENCY
P111
P110
P117
P20