Experian 2014 Annual Report Download - page 136
Download and view the complete annual report
Please find page 136 of the 2014 Experian annual report below. You can navigate through the pages in the report by either clicking on the pages listed below, or by using the keyword search tool below to find specific information within the annual report.-
 1
1 -
2
-
3
-
4
-
5
-
6
-
7
-
8
-
9
-
10
-
11
-
12
-
13
-
14
-
15
-
16
-
17
-
18
-
19
-
20
-
21
-
22
-
23
-
24
-
25
-
26
-
27
-
28
-
29
-
30
-
31
-
32
-
33
-
34
-
35
-
36
-
37
-
38
-
39
-
40
-
41
-
42
-
43
-
44
-
45
-
46
-
47
-
48
-
49
-
50
-
51
-
52
-
53
-
54
-
55
-
56
-
57
-
58
-
59
-
60
-
61
-
62
-
63
-
64
-
65
-
66
-
67
-
68
-
69
-
70
-
71
-
72
-
73
-
74
-
75
-
76
-
77
-
78
-
79
-
80
-
81
-
82
-
83
-
84
-
85
-
86
-
87
-
88
-
89
-
90
-
91
-
92
-
93
-
94
-
95
-
96
-
97
-
98
-
99
-
100
-
101
-
102
-
103
-
104
-
105
-
106
-
107
-
108
-
109
-
110
-
111
-
112
-
113
-
114
-
115
-
116
-
117
-
118
-
119
-
120
-
121
-
122
-
123
-
124
-
125
-
 126
126 -
 127
127 -
 128
128 -
 129
129 -
 130
130 -
 131
131 -
 132
132 -
 133
133 -
 134
134 -
 135
135 -
 136
136 -
 137
137 -
 138
138 -
 139
139 -
 140
140 -
 141
141 -
 142
142 -
 143
143 -
 144
144 -
 145
145 -
 146
146 -
147
-
148
-
149
-
150
-
151
-
152
-
153
-
154
-
155
-
156
-
157
-
158
-
159
-
160
-
161
-
162
-
163
-
164
-
165
-
166
-
167
-
168
-
169
-
170
-
171
-
172
-
173
-
174
-
175
-
176
-
177
-
178
 |
 |

Financial statements • Notes to the Group financial statements
Notes to the Group financial statements
for the year ended 31 March 2014 continued
132
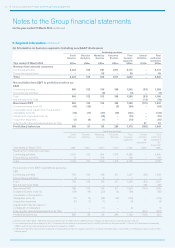
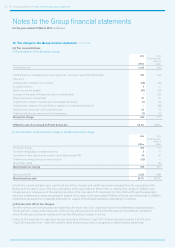
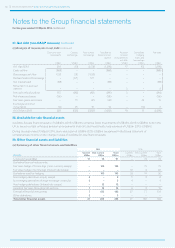
18. Earnings per share disclosures
(a) Earnings per share
Basic Diluted
2014
US cents
2013
(Re-presented)
(Note 3)
US cents
2014
US cents
2013
(Re-presented)
(Note 3)
US cents
Continuing and discontinued operations 76.8 36.6 75.8 35.9
Deduct: discontinued operations (0.7) (11.9) (0.7) (11.7)
Continuing operations 76.1 24.7 75.1 24.2
Add: exceptional items and other adjustments made to derive
Benchmark PBT 15.6 60.5 15.4 59.2
Benchmark earnings per share from continuing operations
(non-GAAP measure) 91.7 85.2 90.5 83.4
(b) Earnings attributable to owners of Experian plc
2014
US$m
2013
(Re-presented)
(Note 3)
US$m
Continuing and discontinued operations 753 362
Deduct: discontinued operations (7) (118)
Continuing operations 746 244
Add: exceptional items and other adjustments made to derive Benchmark PBT 153 598
Benchmark earnings attributable to owners of Experian plc (non-GAAP measure) 899 842
(c) Earnings attributable to non-controlling interests
2014
US$m
2013
US$m
Continuing and discontinued operations 139
Add: amortisation of acquisition intangibles attributable to non-controlling interests 3 7
Benchmark earnings attributable to non-controlling interests (non-GAAP measure) 4 46
(d) Reconciliation of Overall benchmark earnings to profit for the financial year
2014
US$m
2013
(Re-presented)
(Note 3)
US$m
Overall benchmark earnings (non-GAAP measure) 903 888
Profit from discontinued operations 7 118
Loss from exceptional items and other adjustments made to derive Benchmark PBT (156) (605)
Profit for the financial year 754 401
(e) Weighted average number of ordinary shares used
2014
million
2013
million
Weighted average number of ordinary shares 980 988
Add: dilutive effect of share incentive awards, options and share purchases 13 21
Diluted weighted average number of ordinary shares 993 1,009