Experian 2014 Annual Report Download - page 47
Download and view the complete annual report
Please find page 47 of the 2014 Experian annual report below. You can navigate through the pages in the report by either clicking on the pages listed below, or by using the keyword search tool below to find specific information within the annual report.
43
Strategic report • Financial review
Exceptional items –
continuing operations
As shown in the table below, there was
an exceptional charge of US$54m in the
year (2013: US$66m). The charge for the
year includes:
• Restructuring costs which are the
costs we incurred following the
strategic review of our cost base
during the year ended 31 March
2013. Note 13 to the Group financial
statements gives further details.
• The gain on disposal of businesses
in the year relating to a number of
small disposals.
Net interest expense
The net interest expense for the year
was US$74m (2013: US$62m). The key
driver of the increase was the full-year
effect of the additional funding for the
acquisition of the further 29.6% stake
in Serasa in November 2012, and the
effect of the US$1.2bn we spent on the
Passport Health Communications and
41st Parameter acquisitions in the US
in the second half of the year ended
31 March 2014.
Experian remains strongly cash
generative and both our interest cost
and the amount paid have continued to
benefit from low interest rates globally.
Ta x
The Benchmark tax rate was 26.7% (2013:
25.3%). The increase reflects higher profits
in the US, which has a corporate tax rate
above the main UK rate. Note 16 to the
Group financial statements includes a
reconciliation of the Benchmark tax charge.
The tax charge for the year was US$302m
and the effective tax rate was 28.8%. This
is higher than the Benchmark tax rate,
primarily reflecting the reduction in the
main rate of UK corporation tax from
23% to 20% and the associated reduction
in deferred tax assets we recognise in
respect of tax losses. The blended tax
rate on exceptional items and other
adjustments made to derive Benchmark
PBT was 27.3%.
The tax charge for the year ended
31 March 2013 was US$151m and the
effective tax rate was 34.8%. This was
higher than the Benchmark tax rate,
primarily because our statutory profit
before tax included the charge for the
Serasa put option, on which there was
no tax relief, while there was a one-off
tax benefit on a corporate transaction
in respect of our Colombia business.
Earnings and dividends per share
Basic earnings per share were 76.8
US cents (2013: 36.6 US cents). Basic
earnings per share included 0.7 US
cents (2013: 11.9 US cents) in respect of
discontinued operations (see note 17).
Benchmark EPS increased to 91.7 US
cents, from 85.2 US cents last year.
The second interim dividend is 26.00 US
cents per share (2013: 24.00 US cents)
giving a total dividend for the year of
37.50 US cents (2013: 34.75 US cents),
an increase of 8%. This is covered 2.4
times by Benchmark EPS.
Group income
statement commentary
Revenue and profit performance –
continuing operations
Revenue increased from US$4,730m
in the prior year to US$4,840m in the
year ended 31 March 2014. At constant
exchange rates, we delivered organic
revenue growth of 5% and grew total
EBIT by 7% to US$1,306m.
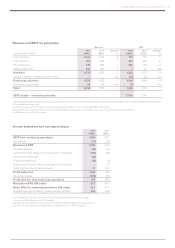
Group profit performance by geography
is discussed earlier in the Strategic
report. This Financial review includes
tables giving an additional analysis of
the income statement and summarising
performance by business segment.
Profit before tax from continuing
operations increased by US$615m,
from US$434m to US$1,049m. In the
year ended 31 March 2013, we incurred
a charge of US$558m due to the
movement in the fair value of the Serasa
put option prior to our purchase of the
non-controlling interest. There was no
such charge in the year ended 31 March
2014 and any similar exposures we face
in respect of other transactions are now
comparatively minor. Benchmark PBT
rose by US$43m to US$1,232m (2013:
US$1,189m).
Seasonality
In recent years, our margin progression
has tended to be weighted towards
the second half of the year, reflecting
revenue seasonality and the phasing of
our investment expenditure.
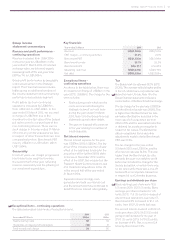
Key financials
Year ended 31 March 2014 2013
Revenue US$4,840m US$4,730m
EBIT margin – continuing activities 27.4% 27.1%
Benchmark PBT US$1,232m US$1,189m
Benchmark tax rate 26.7% 25.3%
Benchmark EPS USc 91.7 USc 85.2
Operating cash flow US$1,321m US$1,175m
Net debt US$3,809m US$2,938m
Exceptional items – continuing operations
The table below gives a summary of exceptional items.
Year ended 31 March
2014
US$m
2013
US$m
Restructuring costs 68 54
(Gain)/loss on disposal of businesses (14) 12
Total exceptional charge 54 66
P129
P127
P132


