Experian 2014 Annual Report Download - page 126
Download and view the complete annual report
Please find page 126 of the 2014 Experian annual report below. You can navigate through the pages in the report by either clicking on the pages listed below, or by using the keyword search tool below to find specific information within the annual report.-
 1
1 -
2
-
3
-
4
-
5
-
6
-
7
-
8
-
9
-
10
-
11
-
12
-
13
-
14
-
15
-
16
-
17
-
18
-
19
-
20
-
21
-
22
-
23
-
24
-
25
-
26
-
27
-
28
-
29
-
30
-
31
-
32
-
33
-
34
-
35
-
36
-
37
-
38
-
39
-
40
-
41
-
42
-
43
-
44
-
45
-
46
-
47
-
48
-
49
-
50
-
51
-
52
-
53
-
54
-
55
-
56
-
57
-
58
-
59
-
60
-
61
-
62
-
63
-
64
-
65
-
66
-
67
-
68
-
69
-
70
-
71
-
72
-
73
-
74
-
75
-
76
-
77
-
78
-
79
-
80
-
81
-
82
-
83
-
84
-
85
-
86
-
87
-
88
-
89
-
90
-
91
-
92
-
93
-
94
-
95
-
96
-
97
-
98
-
99
-
100
-
101
-
102
-
103
-
104
-
105
-
106
-
107
-
108
-
109
-
110
-
111
-
112
-
113
-
114
-
115
-
 116
116 -
 117
117 -
 118
118 -
 119
119 -
 120
120 -
 121
121 -
 122
122 -
 123
123 -
 124
124 -
 125
125 -
 126
126 -
 127
127 -
 128
128 -
 129
129 -
 130
130 -
 131
131 -
 132
132 -
 133
133 -
 134
134 -
 135
135 -
 136
136 -
137
-
138
-
139
-
140
-
141
-
142
-
143
-
144
-
145
-
146
-
147
-
148
-
149
-
150
-
151
-
152
-
153
-
154
-
155
-
156
-
157
-
158
-
159
-
160
-
161
-
162
-
163
-
164
-
165
-
166
-
167
-
168
-
169
-
170
-
171
-
172
-
173
-
174
-
175
-
176
-
177
-
178
 |
 |
Financial statements • Notes to the Group financial statements
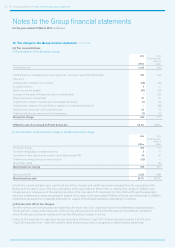
Notes to the Group financial statements
for the year ended 31 March 2014 continued
122
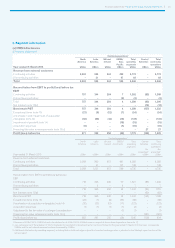
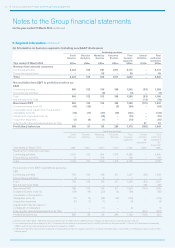
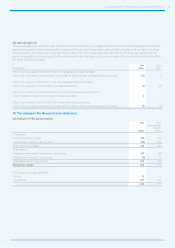
9. Segment information continued
(ii) Balance sheet
Net assets/(liabilities)
At 31 March 2014
North
America
US$m
Latin
America
US$m
UK and
Ireland
US$m
EMEA/
Asia Pacific
US$m
Total
operating
segments
US$m
Central
Activities
and other
US$m
Total
Group
US$m
Goodwill 2,537 1,142 733 395 4,807 – 4,807
Investments in associates 3 – – 10 13 – 13
Other assets 1,644 721 524 347 3,236 1,116 4,352
Total assets 4,184 1,863 1,257 752 8,056 1,116 9,172
Total liabilities (507) (173) (352) (257) (1,289) (4,779) (6,068)
Net assets/(liabilities) 3,677 1,690 905 495 6,767 (3,663) 3,104
At 31 March 2013
North
America
US$m
Latin
America
US$m
UK and
Ireland
US$m
EMEA/
Asia Pacific
US$m
Total
operating
segments
US$m
Central
Activities
and other
US$m
Total
Group
US$m
Goodwill 1,810 1,214 660 373 4,057 – 4,057
Investments in associates 2 10 – 9 21 – 21
Other assets 1,074 837 535 391 2,837 1,280 4,117
Total assets 2,886 2,061 1,19 5 773 6,915 1,280 8,195
Total liabilities (487) (219) (324) (277) (1,307) (3,664) (4,971)
Net assets/(liabilities) 2,399 1,842 871 496 5,608 (2,384) 3,224
Central Activities and other comprises:
2014 2013
Assets
US$m
Liabilities
US$m
Net assets/
(liabilities)
US$m
Assets
US$m
Liabilities
US$m
Net assets/
(liabilities)
US$m
Central Activities 296 (120) 176 285 (160) 125
Net debt 347 (4,156) (3,809) 303 (3,241) (2,938)
Tax 473 (503) (30) 692 (263) 429
1,116 (4,779) (3,663) 1,280 (3,664) (2,384)
Capital employed
2014
US$m
2013
US$m
North America 3,677 2,399
Latin America 1,690 1,842
UK and Ireland 905 871
EMEA/Asia Pacific 495 496
Total operating segments 6,767 5,608
Central Activities 176 125
Non-controlling interests (22) (40)
Total capital employed attributable to owners 6,921 5,693