Experian 2014 Annual Report Download - page 52
Download and view the complete annual report
Please find page 52 of the 2014 Experian annual report below. You can navigate through the pages in the report by either clicking on the pages listed below, or by using the keyword search tool below to find specific information within the annual report.-
 1
1 -
2
-
3
-
4
-
5
-
6
-
7
-
8
-
9
-
10
-
11
-
12
-
13
-
14
-
15
-
16
-
17
-
18
-
19
-
20
-
21
-
22
-
23
-
24
-
25
-
26
-
27
-
28
-
29
-
30
-
31
-
32
-
33
-
34
-
35
-
36
-
37
-
38
-
39
-
40
-
41
-
 42
42 -
 43
43 -
 44
44 -
 45
45 -
 46
46 -
 47
47 -
 48
48 -
 49
49 -
 50
50 -
 51
51 -
 52
52 -
 53
53 -
 54
54 -
 55
55 -
 56
56 -
 57
57 -
 58
58 -
 59
59 -
 60
60 -
 61
61 -
 62
62 -
63
-
64
-
65
-
66
-
67
-
68
-
69
-
70
-
71
-
72
-
73
-
74
-
75
-
76
-
77
-
78
-
79
-
80
-
81
-
82
-
83
-
84
-
85
-
86
-
87
-
88
-
89
-
90
-
91
-
92
-
93
-
94
-
95
-
96
-
97
-
98
-
99
-
100
-
101
-
102
-
103
-
104
-
105
-
106
-
107
-
108
-
109
-
110
-
111
-
112
-
113
-
114
-
115
-
116
-
117
-
118
-
119
-
120
-
121
-
122
-
123
-
124
-
125
-
126
-
127
-
128
-
129
-
130
-
131
-
132
-
133
-
134
-
135
-
136
-
137
-
138
-
139
-
140
-
141
-
142
-
143
-
144
-
145
-
146
-
147
-
148
-
149
-
150
-
151
-
152
-
153
-
154
-
155
-
156
-
157
-
158
-
159
-
160
-
161
-
162
-
163
-
164
-
165
-
166
-
167
-
168
-
169
-
170
-
171
-
172
-
173
-
174
-
175
-
176
-
177
-
178
 |
 |
48 Strategic report • Financial review
Interest rate risk is managed by:
• using fixed and floating rate
borrowings and interest rate swaps
to adjust the balance between the
two; and
• mixing the duration of borrowings
and interest rate swaps to smooth the
impact of interest rate fluctuations.
Credit risk is managed by:
• dealing only with banks and
financial institutions with strong
credit ratings, within limits set for
each organisation; and
• closely controlling dealing activity
and regularly monitoring
counterparty positions.
Liquidity risk is managed by:
• the issue of long maturity bonds
and notes;
• entering into long-term committed
bank borrowing facilities to ensure we
have sufficient funds available for our
operations and planned growth; and
• monitoring rolling cash flow forecasts
to ensure we have adequate
borrowing facilities.
Capital risk management
Our definition and management of capital
focuses on capital employed. The Group’s
capital employed is analysed in the net
assets summary table.
Our objectives in managing capital are:
• to safeguard our ability to continue as
a going concern in order to provide
returns for shareholders and benefits
for other stakeholders; and
• to maintain an optimal capital
structure and cost of capital.
Our policy remains to have:
• a prudent but efficient balance
sheet; and
• a target gearing ratio of 1.75 to 2.00
times EBITDA, consistent with our
intention to retain strong investment-
grade credit ratings.
To maintain or adjust our capital
structure, we may:
• adjust the amount of dividends
we pay to shareholders;
• return capital to shareholders;
• issue or purchase ordinary shares; or
• sell assets to reduce net debt.
Going concern
The Board formed a judgment, at the time
of approving the Group and the parent
company financial statements, that there
was a reasonable expectation that the
Group and the Company had adequate
resources to continue in operational
existence for the foreseeable future. In
arriving at this conclusion, the Board took
account of:
• current and anticipated trading
performance which is the subject of
detailed comment elsewhere in the
Strategic report;
• current and anticipated levels of
borrowings and the availability of the
committed borrowing facilities; and
• exposures to and management of
financial risks, which are summarised
above and detailed in the notes to the
Group financial statements.
For this reason, we continue to adopt
the going concern basis in preparing
the Group and the parent company
financial statements.
Roundings
Certain financial data have been rounded
in this report. As a result, the totals of
data presented may vary slightly from the
actual arithmetic totals of the data.
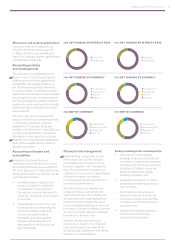
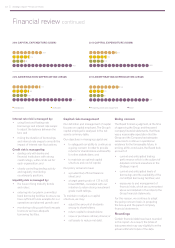
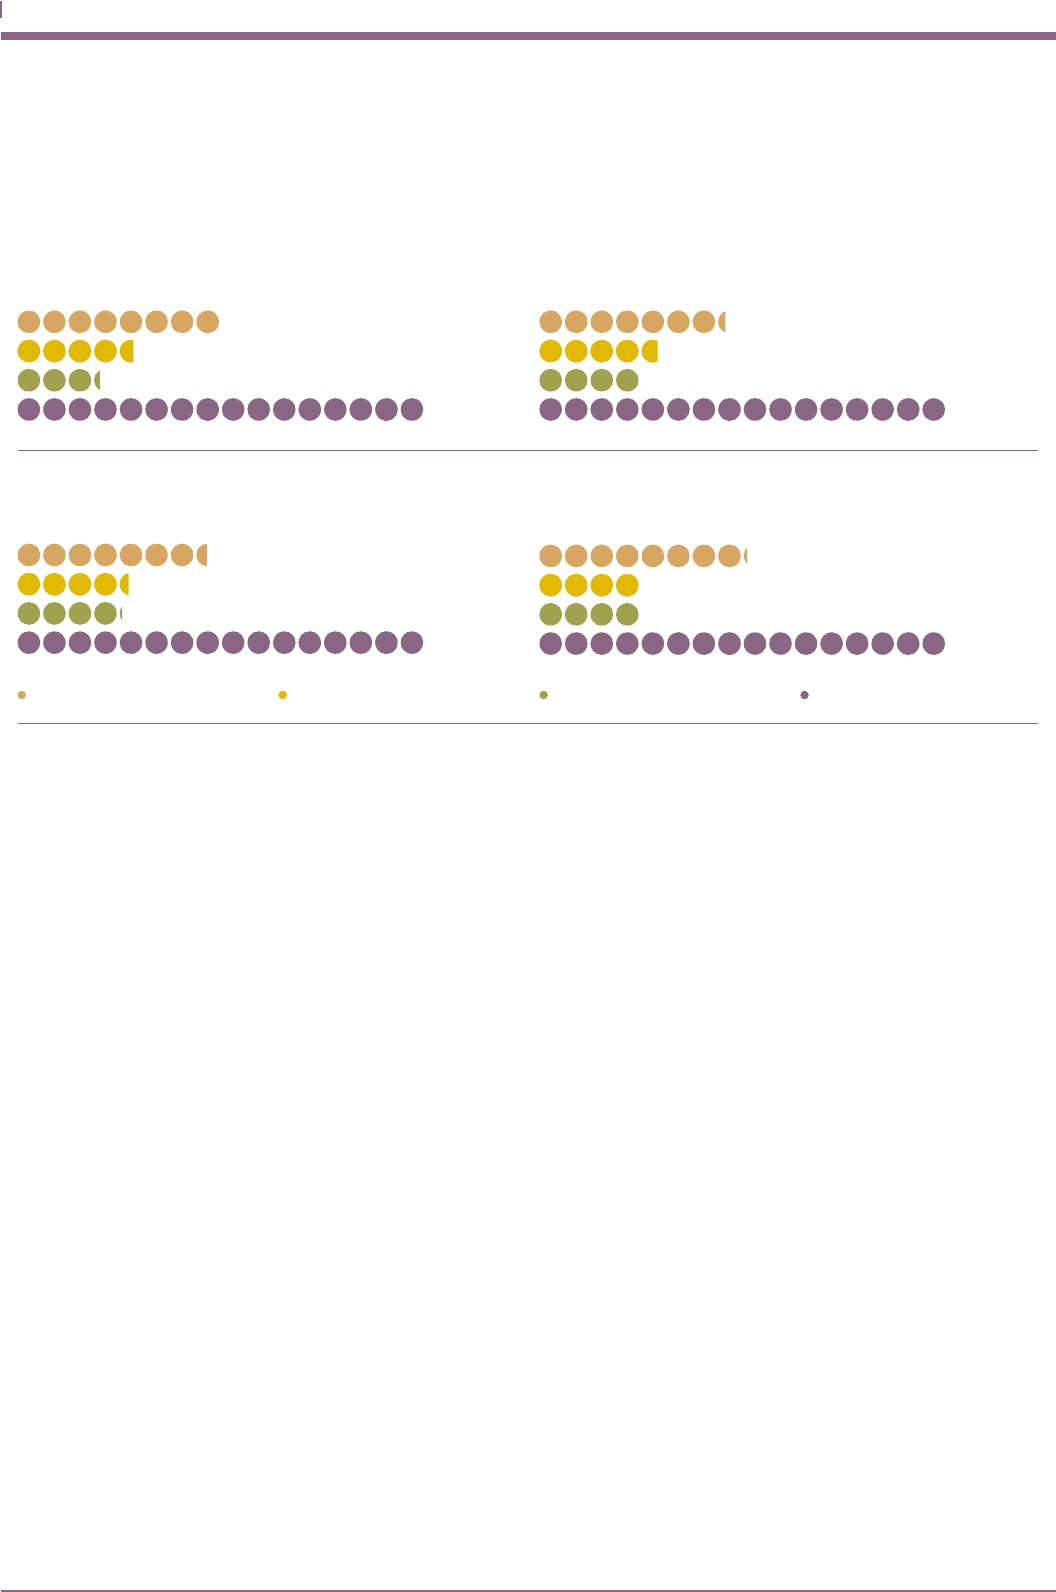
2013 CAPITAL EXPENDITURE (US$M)2014 CAPITAL EXPENDITURE (US$M)
2013 AMORTISATION/DEPRECIATION/(US$M)2014 AMORTISATION/DEPRECIATION (US$M)
Databases Software Property, plant and equipment Total
211
168
460
329
134
80
11583
402
116
203
173
102
96
371
81
Financial review continued