Experian 2014 Annual Report Download - page 156
Download and view the complete annual report
Please find page 156 of the 2014 Experian annual report below. You can navigate through the pages in the report by either clicking on the pages listed below, or by using the keyword search tool below to find specific information within the annual report.-
 1
1 -
2
-
3
-
4
-
5
-
6
-
7
-
8
-
9
-
10
-
11
-
12
-
13
-
14
-
15
-
16
-
17
-
18
-
19
-
20
-
21
-
22
-
23
-
24
-
25
-
26
-
27
-
28
-
29
-
30
-
31
-
32
-
33
-
34
-
35
-
36
-
37
-
38
-
39
-
40
-
41
-
42
-
43
-
44
-
45
-
46
-
47
-
48
-
49
-
50
-
51
-
52
-
53
-
54
-
55
-
56
-
57
-
58
-
59
-
60
-
61
-
62
-
63
-
64
-
65
-
66
-
67
-
68
-
69
-
70
-
71
-
72
-
73
-
74
-
75
-
76
-
77
-
78
-
79
-
80
-
81
-
82
-
83
-
84
-
85
-
86
-
87
-
88
-
89
-
90
-
91
-
92
-
93
-
94
-
95
-
96
-
97
-
98
-
99
-
100
-
101
-
102
-
103
-
104
-
105
-
106
-
107
-
108
-
109
-
110
-
111
-
112
-
113
-
114
-
115
-
116
-
117
-
118
-
119
-
120
-
121
-
122
-
123
-
124
-
125
-
126
-
127
-
128
-
129
-
130
-
131
-
132
-
133
-
134
-
135
-
136
-
137
-
138
-
139
-
140
-
141
-
142
-
143
-
144
-
145
-
 146
146 -
 147
147 -
 148
148 -
 149
149 -
 150
150 -
 151
151 -
 152
152 -
 153
153 -
 154
154 -
 155
155 -
 156
156 -
 157
157 -
 158
158 -
 159
159 -
 160
160 -
 161
161 -
 162
162 -
 163
163 -
 164
164 -
 165
165 -
 166
166 -
167
-
168
-
169
-
170
-
171
-
172
-
173
-
174
-
175
-
176
-
177
-
178
 |
 |

Financial statements • Notes to the Group financial statements
Notes to the Group financial statements
for the year ended 31 March 2014 continued
152
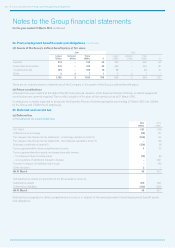
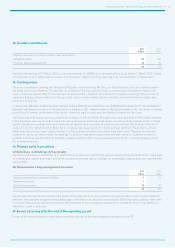
34. Post-employment benefit assets and obligations continued
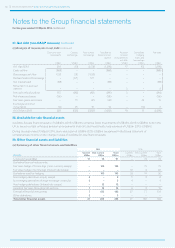
(d) Assets of the Group’s defined benefit plans at fair value
2014 2013
Listed
US$m
Unlisted
US$m
Total
US$m %
Listed
US$m
Unlisted
US$m
Total
US$m %
Equities 514 – 514 46 440 – 440 44
Fixed interest securities 475 – 475 43 449 – 449 45
Investment funds 108 –108 10 98 – 98 10
Other 5 2 7 1 5 2 7 1
1,102 2 1,104 100 992 2 994 100
There are no ordinary shares or debentures of the Company in the assets of the Group’s defined benefit plans.
(e) Future contributions
Although there was a deficit at the date of the 2013 full actuarial valuation of the Experian Pension Scheme, no deficit repayment
contributions are currently required. The next full valuation of the plan will be carried out as at 31 March 2016.
Contributions currently expected to be paid to the Experian Pension Scheme during the year ending 31 March 2015 are US$8m
by the Group and US$3m by its employees.
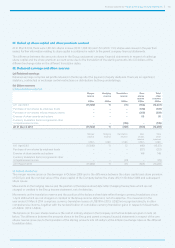
35. Deferred and current tax
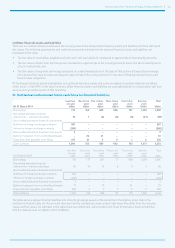
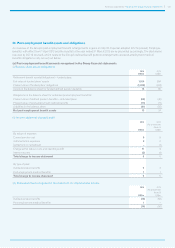
(a) Deferred tax
(i) Net deferred tax assets/(liabilities)
2014
US$m
2013
US$m
At 1 April 421 (59)
Differences on exchange (33) 29
Tax charge in the Group income statement – continuing operations (note 16) (163) 33
Tax charge in the Group income statement – discontinued operations (note 17) – (13)
Business combinations (note 40) (170) (3)
Tax recognised within other comprehensive income 4 13
Tax recognised directly in equity on transactions with owners:
– for employee share incentive plans (13) (6)
– on acquisition of additional interest in Serasa – 462
Transfer in respect of liabilities held for sale – (36)
Other transfers 2 1
At 31 March 48 421
Net deferred tax assets are presented in the Group balance sheet as:
Deferred tax assets 460 643
Deferred tax liabilities (412) (222)
At 31 March 48 421
Deferred tax recognised in other comprehensive income is in respect of the remeasurement of post-employment benefit assets
and obligations.