Experian 2014 Annual Report Download - page 131
Download and view the complete annual report
Please find page 131 of the 2014 Experian annual report below. You can navigate through the pages in the report by either clicking on the pages listed below, or by using the keyword search tool below to find specific information within the annual report.-
 1
1 -
2
-
3
-
4
-
5
-
6
-
7
-
8
-
9
-
10
-
11
-
12
-
13
-
14
-
15
-
16
-
17
-
18
-
19
-
20
-
21
-
22
-
23
-
24
-
25
-
26
-
27
-
28
-
29
-
30
-
31
-
32
-
33
-
34
-
35
-
36
-
37
-
38
-
39
-
40
-
41
-
42
-
43
-
44
-
45
-
46
-
47
-
48
-
49
-
50
-
51
-
52
-
53
-
54
-
55
-
56
-
57
-
58
-
59
-
60
-
61
-
62
-
63
-
64
-
65
-
66
-
67
-
68
-
69
-
70
-
71
-
72
-
73
-
74
-
75
-
76
-
77
-
78
-
79
-
80
-
81
-
82
-
83
-
84
-
85
-
86
-
87
-
88
-
89
-
90
-
91
-
92
-
93
-
94
-
95
-
96
-
97
-
98
-
99
-
100
-
101
-
102
-
103
-
104
-
105
-
106
-
107
-
108
-
109
-
110
-
111
-
112
-
113
-
114
-
115
-
116
-
117
-
118
-
119
-
120
-
 121
121 -
 122
122 -
 123
123 -
 124
124 -
 125
125 -
 126
126 -
 127
127 -
 128
128 -
 129
129 -
 130
130 -
 131
131 -
 132
132 -
 133
133 -
 134
134 -
 135
135 -
 136
136 -
 137
137 -
 138
138 -
 139
139 -
 140
140 -
 141
141 -
142
-
143
-
144
-
145
-
146
-
147
-
148
-
149
-
150
-
151
-
152
-
153
-
154
-
155
-
156
-
157
-
158
-
159
-
160
-
161
-
162
-
163
-
164
-
165
-
166
-
167
-
168
-
169
-
170
-
171
-
172
-
173
-
174
-
175
-
176
-
177
-
178
 |
 |
Financial statements • Notes to the Group financial statements 127
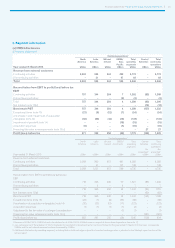
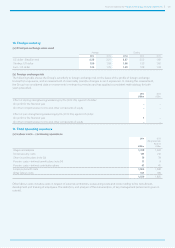
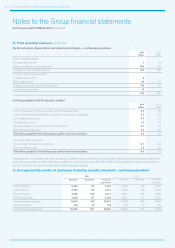
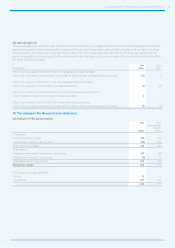
13. Exceptional items – continuing operations
2014
US$m
2013
US$m
Restructuring costs:
Redundancy costs 61 41
Asset write-offs 7 13
Restructuring costs 68 54
(Gain)/loss on disposal of businesses (14) 12
Total exceptional items 54 66
By income statement caption:
Labour costs 61 41
Amortisation, depreciation and impairment charges 7 13
Other operating charges (14) 12
Total exceptional items 54 66
The Group conducted a strategic review of its cost base during the year ended 31 March 2013 and recognised a charge of US$54m in
connection with this significant programme in that year and a further charge of US$68m in the year ended 31 March 2014. The cash
outflow from the restructuring programme in the year ended 31 March 2014 was US$65m (2013: US$27m) and a reconciliation of the
charge to the cash outflow is given in note 39(c).
The gain on disposal of businesses in the year ended 31 March 2014 related to a number of small disposals with a related cash inflow
of US$25m. The loss in the prior year of US$12m also related to small disposals and there was a cash inflow of US$5m in that year.
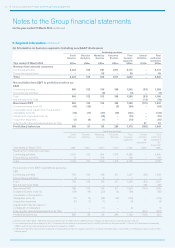
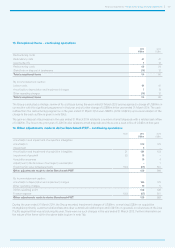
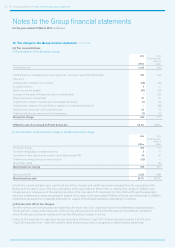
14. Other adjustments made to derive Benchmark PBT – continuing operations
Note 2014
US$m
2013
US$m
Amortisation and impairment of acquisition intangibles:
Amortisation 122 123
Impairment 9 –
Amortisation and impairment of acquisition intangibles 21 131 123
Impairment of goodwill 20 15 –
Acquisition expenses 10 4
Adjustment to the fair value of contingent consideration – 1
Financing fair value remeasurements 15(c) (27) 561
Other adjustments made to derive Benchmark PBT 129 689
By income statement caption:
Amortisation, depreciation and impairment charges 146 123
Other operating charges 10 5
Within operating profit 156 128
Finance expense 15(c) (27) 561
Other adjustments made to derive Benchmark PBT 129 689
During the year ended 31 March 2014, the Group recorded impairment charges of US$24m, comprising US$9m on acquisition
intangibles (primarily customer relationships and other contractual relationships) and US$15m on goodwill, on a business in the Asia
Pacific segment that was sold during the year. There were no such charges in the year ended 31 March 2013. Further information on
the nature of the items within the above table is given in note 7(a).