Experian 2014 Annual Report Download - page 168
Download and view the complete annual report
Please find page 168 of the 2014 Experian annual report below. You can navigate through the pages in the report by either clicking on the pages listed below, or by using the keyword search tool below to find specific information within the annual report.-
 1
1 -
2
-
3
-
4
-
5
-
6
-
7
-
8
-
9
-
10
-
11
-
12
-
13
-
14
-
15
-
16
-
17
-
18
-
19
-
20
-
21
-
22
-
23
-
24
-
25
-
26
-
27
-
28
-
29
-
30
-
31
-
32
-
33
-
34
-
35
-
36
-
37
-
38
-
39
-
40
-
41
-
42
-
43
-
44
-
45
-
46
-
47
-
48
-
49
-
50
-
51
-
52
-
53
-
54
-
55
-
56
-
57
-
58
-
59
-
60
-
61
-
62
-
63
-
64
-
65
-
66
-
67
-
68
-
69
-
70
-
71
-
72
-
73
-
74
-
75
-
76
-
77
-
78
-
79
-
80
-
81
-
82
-
83
-
84
-
85
-
86
-
87
-
88
-
89
-
90
-
91
-
92
-
93
-
94
-
95
-
96
-
97
-
98
-
99
-
100
-
101
-
102
-
103
-
104
-
105
-
106
-
107
-
108
-
109
-
110
-
111
-
112
-
113
-
114
-
115
-
116
-
117
-
118
-
119
-
120
-
121
-
122
-
123
-
124
-
125
-
126
-
127
-
128
-
129
-
130
-
131
-
132
-
133
-
134
-
135
-
136
-
137
-
138
-
139
-
140
-
141
-
142
-
143
-
144
-
145
-
146
-
147
-
148
-
149
-
150
-
151
-
152
-
153
-
154
-
155
-
156
-
157
-
 158
158 -
 159
159 -
 160
160 -
 161
161 -
 162
162 -
 163
163 -
 164
164 -
 165
165 -
 166
166 -
 167
167 -
 168
168 -
 169
169 -
 170
170 -
 171
171 -
 172
172 -
 173
173 -
 174
174 -
 175
175 -
 176
176 -
 177
177 -
 178
178
 |
 |

164
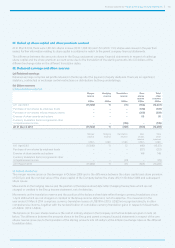
Profit and loss account
for the year ended 31 March 2014
Continuing operations
Notes
2014
US$m
2013
US$m
Other operating income C64.7 –
Staff costs D(3.8) (4.0)
Depreciation (0.3) (0.2)
Other operating charges C(87.8) (37.0)
Operating loss (27.2) (41.2)
Interest receivable and similar income – foreign exchange gains 17.1 –
Interest payable and similar charges E(0.7) (9.8)
Loss on ordinary activities before tax (10.8) (51.0)
Tax on loss on ordinary activities F– –
Loss on ordinary activities after tax and for the financial year (10.8) (51.0)
There is no material difference between the loss on ordinary activities before tax and the loss for the financial year stated above
and their historical cost equivalents.
The Company has no recognised gains and losses other than those included in the profit and loss account, and therefore no
separate statement of total recognised gains and losses has been presented.
Financial statements • Profit and loss account / Balance sheet
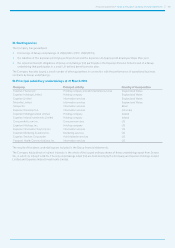
Notes 2014
US$m
2013
US$m
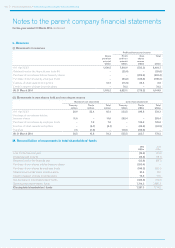
Fixed assets
Tangible assets 0.6 0.9
Investments – shares in Group undertakings H5,895.9 5,825.7
5,896.5 5,826.6
Current assets
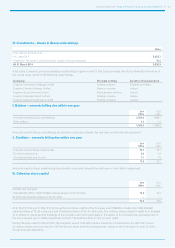
Debtors – amounts falling due within one year I1,568.0 1,968.5
Cash at bank and in hand 0.6 0.2
1,568.6 1,968.7
Current liabilities
Creditors – amounts falling due within one year J(77.8) (81.1)
Net current assets 1,490.8 1,887.6
Net assets 7,387.3 7,714.2
Capital and reserves
Called up share capital K79.2 79.0
Share premium account L1,163.2 1,150.5
Profit and loss account L6,144.9 6,484.7
Total shareholders’ funds M7,387.3 7,714.2
These financial statements were approved by the Board on 6 May 2014 and were signed on its behalf by:
Sir Alan Rudge
Director
Balance sheet
at 31 March 2014