Experian 2014 Annual Report Download - page 141
Download and view the complete annual report
Please find page 141 of the 2014 Experian annual report below. You can navigate through the pages in the report by either clicking on the pages listed below, or by using the keyword search tool below to find specific information within the annual report.-
 1
1 -
2
-
3
-
4
-
5
-
6
-
7
-
8
-
9
-
10
-
11
-
12
-
13
-
14
-
15
-
16
-
17
-
18
-
19
-
20
-
21
-
22
-
23
-
24
-
25
-
26
-
27
-
28
-
29
-
30
-
31
-
32
-
33
-
34
-
35
-
36
-
37
-
38
-
39
-
40
-
41
-
42
-
43
-
44
-
45
-
46
-
47
-
48
-
49
-
50
-
51
-
52
-
53
-
54
-
55
-
56
-
57
-
58
-
59
-
60
-
61
-
62
-
63
-
64
-
65
-
66
-
67
-
68
-
69
-
70
-
71
-
72
-
73
-
74
-
75
-
76
-
77
-
78
-
79
-
80
-
81
-
82
-
83
-
84
-
85
-
86
-
87
-
88
-
89
-
90
-
91
-
92
-
93
-
94
-
95
-
96
-
97
-
98
-
99
-
100
-
101
-
102
-
103
-
104
-
105
-
106
-
107
-
108
-
109
-
110
-
111
-
112
-
113
-
114
-
115
-
116
-
117
-
118
-
119
-
120
-
121
-
122
-
123
-
124
-
125
-
126
-
127
-
128
-
129
-
130
-
 131
131 -
 132
132 -
 133
133 -
 134
134 -
 135
135 -
 136
136 -
 137
137 -
 138
138 -
 139
139 -
 140
140 -
 141
141 -
 142
142 -
 143
143 -
 144
144 -
 145
145 -
 146
146 -
 147
147 -
 148
148 -
 149
149 -
 150
150 -
 151
151 -
152
-
153
-
154
-
155
-
156
-
157
-
158
-
159
-
160
-
161
-
162
-
163
-
164
-
165
-
166
-
167
-
168
-
169
-
170
-
171
-
172
-
173
-
174
-
175
-
176
-
177
-
178
 |
 |

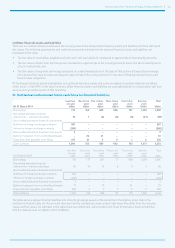
Financial statements • Notes to the Group financial statements 137
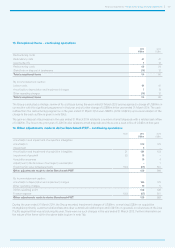
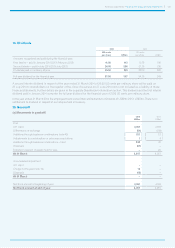
23. Trade and other receivables
(a) Analysis of trade and other receivables by type and maturity
2014 2013
Current
US$m
Non-current
US$m
Current
US$m
Non-current
US$m
Trade receivables 722 – 710 –
Credit note provision (15) – (16) –
Trade receivables – after credit note provision 707 – 694 –
Provision for impairment of trade receivables (36) – (40) –
Trade receivables – net 671 – 654 –
Amounts owed by associates 7 – 3 –
VAT recoverable 3 – 3 –
Other prepayments and accrued income 261 9 263 10
942 9 923 10
There is no material difference between the fair value of trade and other receivables and the book value stated above. The only
impaired assets are within trade receivables.
Trade receivables with financial institutions comprise 36% (2013: 33%) of such receivables in Brazil, 19% (2013: 28%) in the UK and
20% (2013: 21%) in the USA. Together these represent 20% (2013: 22%) of trade receivables with other balances spread across a
number of sectors and geographies.
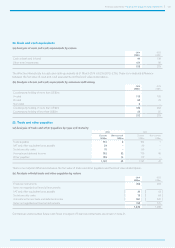
(b) Analysis of total trade and other receivables by nature
2014
US$m
2013
US$m
Financial instruments 712 710
Items not regarded as financial instruments:
VAT recoverable 3 3
Amounts within other prepayments and accrued income 236 220
Items not regarded as financial instruments 239 223
951 933
(c) Analysis of trade and other receivables by denomination of currency
2014 2013
Current
US$m
Non-current
US$m
Current
US$m
Non-current
US$m
US dollar 407 3 338 6
Sterling 221 – 229 –
Brazilian real 141 3 155 2
Euro 75 1 79 –
Other 98 2 122 2
942 9 923 10