Experian 2014 Annual Report Download - page 39
Download and view the complete annual report
Please find page 39 of the 2014 Experian annual report below. You can navigate through the pages in the report by either clicking on the pages listed below, or by using the keyword search tool below to find specific information within the annual report.-
 1
1 -
2
-
3
-
4
-
5
-
6
-
7
-
8
-
9
-
10
-
11
-
12
-
13
-
14
-
15
-
16
-
17
-
18
-
19
-
20
-
21
-
22
-
23
-
24
-
25
-
26
-
27
-
28
-
 29
29 -
 30
30 -
 31
31 -
 32
32 -
 33
33 -
 34
34 -
 35
35 -
 36
36 -
 37
37 -
 38
38 -
 39
39 -
 40
40 -
 41
41 -
 42
42 -
 43
43 -
 44
44 -
 45
45 -
 46
46 -
 47
47 -
 48
48 -
 49
49 -
50
-
51
-
52
-
53
-
54
-
55
-
56
-
57
-
58
-
59
-
60
-
61
-
62
-
63
-
64
-
65
-
66
-
67
-
68
-
69
-
70
-
71
-
72
-
73
-
74
-
75
-
76
-
77
-
78
-
79
-
80
-
81
-
82
-
83
-
84
-
85
-
86
-
87
-
88
-
89
-
90
-
91
-
92
-
93
-
94
-
95
-
96
-
97
-
98
-
99
-
100
-
101
-
102
-
103
-
104
-
105
-
106
-
107
-
108
-
109
-
110
-
111
-
112
-
113
-
114
-
115
-
116
-
117
-
118
-
119
-
120
-
121
-
122
-
123
-
124
-
125
-
126
-
127
-
128
-
129
-
130
-
131
-
132
-
133
-
134
-
135
-
136
-
137
-
138
-
139
-
140
-
141
-
142
-
143
-
144
-
145
-
146
-
147
-
148
-
149
-
150
-
151
-
152
-
153
-
154
-
155
-
156
-
157
-
158
-
159
-
160
-
161
-
162
-
163
-
164
-
165
-
166
-
167
-
168
-
169
-
170
-
171
-
172
-
173
-
174
-
175
-
176
-
177
-
178
 |
 |

Strategic report • North America 35
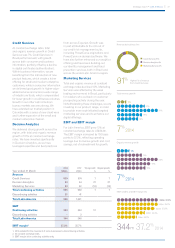
Credit Services
Total revenue growth was 10% and
organic revenue growth was 5%. The
core credit bureau, excluding mortgage,
performed well as clients engaged in
more credit prospecting and origination
activity. Mortgage detracted from growth
however, due to a sharp contraction
in refinancing activity during the
year. Across the verticals, our legacy
healthcare services operations performed
well, as we secured new business
bookings and extended our presence
within the existing base of hospital clients
and physician practices. Automotive
performed strongly, reflecting volume
growth in automotive checks and good
appetite among our dealer and lender
clients for vehicle sales information.
Decision Analytics
Total revenue growth was 23% and
organic revenue growth was 12%. Growth
in Decision Analytics was robust, picking-
up as the year progressed. Our credit
risk management software platform,
PowerCurve, has been well received by
clients and we secured a number of new
wins during the year. In addition, identity
verification volumes were exceptionally
strong, driven by growth across major
federal public sector agencies, as US
citizens enrolled for affordable healthcare
and social security benefits.
Marketing Services
Total revenue growth was 4% and
organic revenue growth was 3%.
Progress in Marketing Services was
encouraging as we secured more client
conversions for our new cross-channel
marketing platform, and as we have built
a strong pipeline of future prospects.
Overall, this led to higher cross-channel
marketing volumes and first-time
contributions from new business wins.
We also saw good demand for digital
services for targeted marketing and in
our data quality operations. This offset
further declines in our more traditional
data and database activities.
Consumer Services
Total and organic revenue growth was
1%. We delivered growth across the
Experian.com brand, affinity and data
breach, which offset a decline in revenue
across the ‘free’ brands. This supports
our strategy to focus the majority of our
investment on building the Experian
brand, developing the affinity channel
and expanding in data breach services.
Over the year, we secured key client wins
in the affinity channel, for which we have
commenced the implementation process.
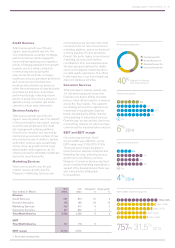
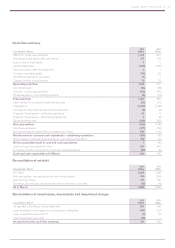
EBIT and EBIT margin
For continuing activities, North
America EBIT was US$757m, up 5%.
EBIT margin was 31.5% (2013: 31.8%).
There was good margin progress in
Credit Services, Decision Analytics and
Marketing Services, reflecting revenue
growth and cost efficiency actions.
Margins in Consumer Services declined
as we increased marketing expenditure in
support of the Experian brand. There was
also some dilution attributable
to acquisitions.
EBIT (US$m) and EBIT margin (%)
40%
Revenue by business line
Credit Services 40%
Decision Analytics 7%
Marketing Services 18%
Consumer Services 35%
Total revenue growth
Organic revenue growth
Highest % of revenue
from Credit Services
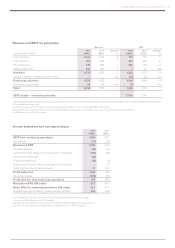
Year ended 31 March
2014
US$m
2013
US$m
Total grow th1
%
Organic growth
1
%
Revenue
Credit Services 961 873 10 5
Decision Analytics 179 146 23 12
Marketing Services 433 417 4 3
Consumer Services 831 822 1 1
Total North America 2,404 2,258 6 4
EBIT
Total North America 757 718 5
EBIT margin 31.5% 31.8%
1. At constant exchange rates.
757m 31.5% 2014
6% 2014
4% 2014
718m 31.8%
31.5%
29.2%
27.8%
658m
572m
556m
757m 31.5%
10
12
11
13
14
4%
7%
7%
0%
6%
10
12
11
13
14
6%
8%
10%
9%
0%
10
12
11
13
14