Experian 2014 Annual Report Download - page 149
Download and view the complete annual report
Please find page 149 of the 2014 Experian annual report below. You can navigate through the pages in the report by either clicking on the pages listed below, or by using the keyword search tool below to find specific information within the annual report.-
 1
1 -
2
-
3
-
4
-
5
-
6
-
7
-
8
-
9
-
10
-
11
-
12
-
13
-
14
-
15
-
16
-
17
-
18
-
19
-
20
-
21
-
22
-
23
-
24
-
25
-
26
-
27
-
28
-
29
-
30
-
31
-
32
-
33
-
34
-
35
-
36
-
37
-
38
-
39
-
40
-
41
-
42
-
43
-
44
-
45
-
46
-
47
-
48
-
49
-
50
-
51
-
52
-
53
-
54
-
55
-
56
-
57
-
58
-
59
-
60
-
61
-
62
-
63
-
64
-
65
-
66
-
67
-
68
-
69
-
70
-
71
-
72
-
73
-
74
-
75
-
76
-
77
-
78
-
79
-
80
-
81
-
82
-
83
-
84
-
85
-
86
-
87
-
88
-
89
-
90
-
91
-
92
-
93
-
94
-
95
-
96
-
97
-
98
-
99
-
100
-
101
-
102
-
103
-
104
-
105
-
106
-
107
-
108
-
109
-
110
-
111
-
112
-
113
-
114
-
115
-
116
-
117
-
118
-
119
-
120
-
121
-
122
-
123
-
124
-
125
-
126
-
127
-
128
-
129
-
130
-
131
-
132
-
133
-
134
-
135
-
136
-
137
-
138
-
 139
139 -
 140
140 -
 141
141 -
 142
142 -
 143
143 -
 144
144 -
 145
145 -
 146
146 -
 147
147 -
 148
148 -
 149
149 -
 150
150 -
 151
151 -
 152
152 -
 153
153 -
 154
154 -
 155
155 -
 156
156 -
 157
157 -
 158
158 -
 159
159 -
160
-
161
-
162
-
163
-
164
-
165
-
166
-
167
-
168
-
169
-
170
-
171
-
172
-
173
-
174
-
175
-
176
-
177
-
178
 |
 |

Financial statements • Notes to the Group financial statements 145
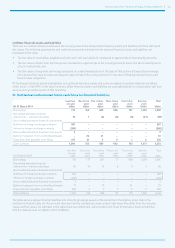
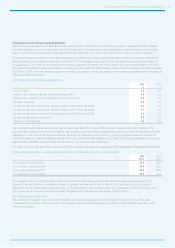
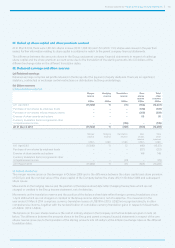
(c) Other financial assets and liabilities
There are no material differences between the carrying value of the Group’s other financial assets and liabilities and their estimated
fair values. The following assumptions and methods are used to estimate the fair values of financial assets and liabilities not
measured at fair value:
• The fair value of receivables, payables and cash and cash equivalents is considered to approximate to the carrying amounts;
• The fair values of short-term borrowings are considered to approximate to the carrying amounts due to the short maturity terms
of such instruments; and
• The fair values of long-term borrowings are based on quoted market prices in the case of that portion of fixed rate borrowings
not carried at fair value and are considered to approximate to the carrying amount in the case of floating rate bank loans and
finance lease obligations.
Of the Group’s financial assets and liabilities not carried at fair value, bonds and notes are based on quoted market prices falling
within Level 1 of the IFRS 13 fair value hierarchy. Other financial assets and liabilities are calculated based on a discounted cash flow
analysis and are within Level 2 of that hierarchy.
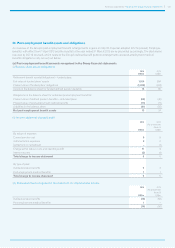
31. Contractual undiscounted future cash flows for financial liabilities
At 31 March 2014
Less than
one year
US$m
One to two
years
US$m
Two to three
years
US$m
Three to four
years
US$m
Four to five
years
US$m
Over five
years
US$m
Total
US$m
Borrowings 778 106 820 695 751 1,452 4,602
Net settled derivative financial
instruments – interest rate swaps 12 1 (4) (8) (9) (37) (45)
Gross settled derivative financial instruments:
Outflows for foreign exchange contracts 287 – – – – – 287
Inflows for foreign exchange contracts (285) – – – – – (285)
Gross settled derivative financial instruments 2 – – – – – 2
Options in respect of non-controlling interests – 24 37 – – – 61
Trade and other payables (note 25(b)) 417 21 6 5 1 2 452
Cash outflows 1,209 152 859 692 743 1,417 5,072
At 31 March 2013
Less than
one year
US$m
One to two
years
US$m
Two to three
years
US$m
Three to four
years
US$m
Four to five
years
US$m
Over five
years
US$m
Total
US$m
Borrowings 716 177 567 77 669 1,339 3,545
Net settled derivative financial
instruments – interest rate swaps 20 16 12 8 3 1 60
Gross settled derivative financial instruments:
Outflows for foreign exchange contracts 234 – – – – – 234
Inflows for foreign exchange contracts (231) – – – – – (231)
Gross settled derivative financial instruments 3 – – – – – 3
Options in respect of non-controlling interests 17 – 15 – 41 – 73
Trade and other payables (note 25(b)) 448 3 2 2 2 6 463
Cash outflows 1,204 196 596 87 715 1,346 4,14 4
The table above analyses financial liabilities into maturity groupings based on the period from the balance sheet date to the
contractual maturity date. As the amounts disclosed are the contractual undiscounted cash flows, they differ from the carrying
values and fair values. As indicated in the table, there are contractual undiscounted cash flows for derivative financial liabilities
which in total amount to US$43m (2013: US$63m).