Experian 2014 Annual Report Download - page 22
Download and view the complete annual report
Please find page 22 of the 2014 Experian annual report below. You can navigate through the pages in the report by either clicking on the pages listed below, or by using the keyword search tool below to find specific information within the annual report.-
 1
1 -
2
-
3
-
4
-
5
-
6
-
7
-
8
-
9
-
10
-
11
-
 12
12 -
 13
13 -
 14
14 -
 15
15 -
 16
16 -
 17
17 -
 18
18 -
 19
19 -
 20
20 -
 21
21 -
 22
22 -
 23
23 -
 24
24 -
 25
25 -
 26
26 -
 27
27 -
 28
28 -
 29
29 -
 30
30 -
 31
31 -
 32
32 -
33
-
34
-
35
-
36
-
37
-
38
-
39
-
40
-
41
-
42
-
43
-
44
-
45
-
46
-
47
-
48
-
49
-
50
-
51
-
52
-
53
-
54
-
55
-
56
-
57
-
58
-
59
-
60
-
61
-
62
-
63
-
64
-
65
-
66
-
67
-
68
-
69
-
70
-
71
-
72
-
73
-
74
-
75
-
76
-
77
-
78
-
79
-
80
-
81
-
82
-
83
-
84
-
85
-
86
-
87
-
88
-
89
-
90
-
91
-
92
-
93
-
94
-
95
-
96
-
97
-
98
-
99
-
100
-
101
-
102
-
103
-
104
-
105
-
106
-
107
-
108
-
109
-
110
-
111
-
112
-
113
-
114
-
115
-
116
-
117
-
118
-
119
-
120
-
121
-
122
-
123
-
124
-
125
-
126
-
127
-
128
-
129
-
130
-
131
-
132
-
133
-
134
-
135
-
136
-
137
-
138
-
139
-
140
-
141
-
142
-
143
-
144
-
145
-
146
-
147
-
148
-
149
-
150
-
151
-
152
-
153
-
154
-
155
-
156
-
157
-
158
-
159
-
160
-
161
-
162
-
163
-
164
-
165
-
166
-
167
-
168
-
169
-
170
-
171
-
172
-
173
-
174
-
175
-
176
-
177
-
178
 |
 |
18 Strategic report • Key performance indicators
Key performance indicators
We use our key performance indicators to measure our business.
They give us visibility of our financial, strategic, employee engagement
and environmental performance. Three of the financial metrics are
specifically linked to management remuneration.
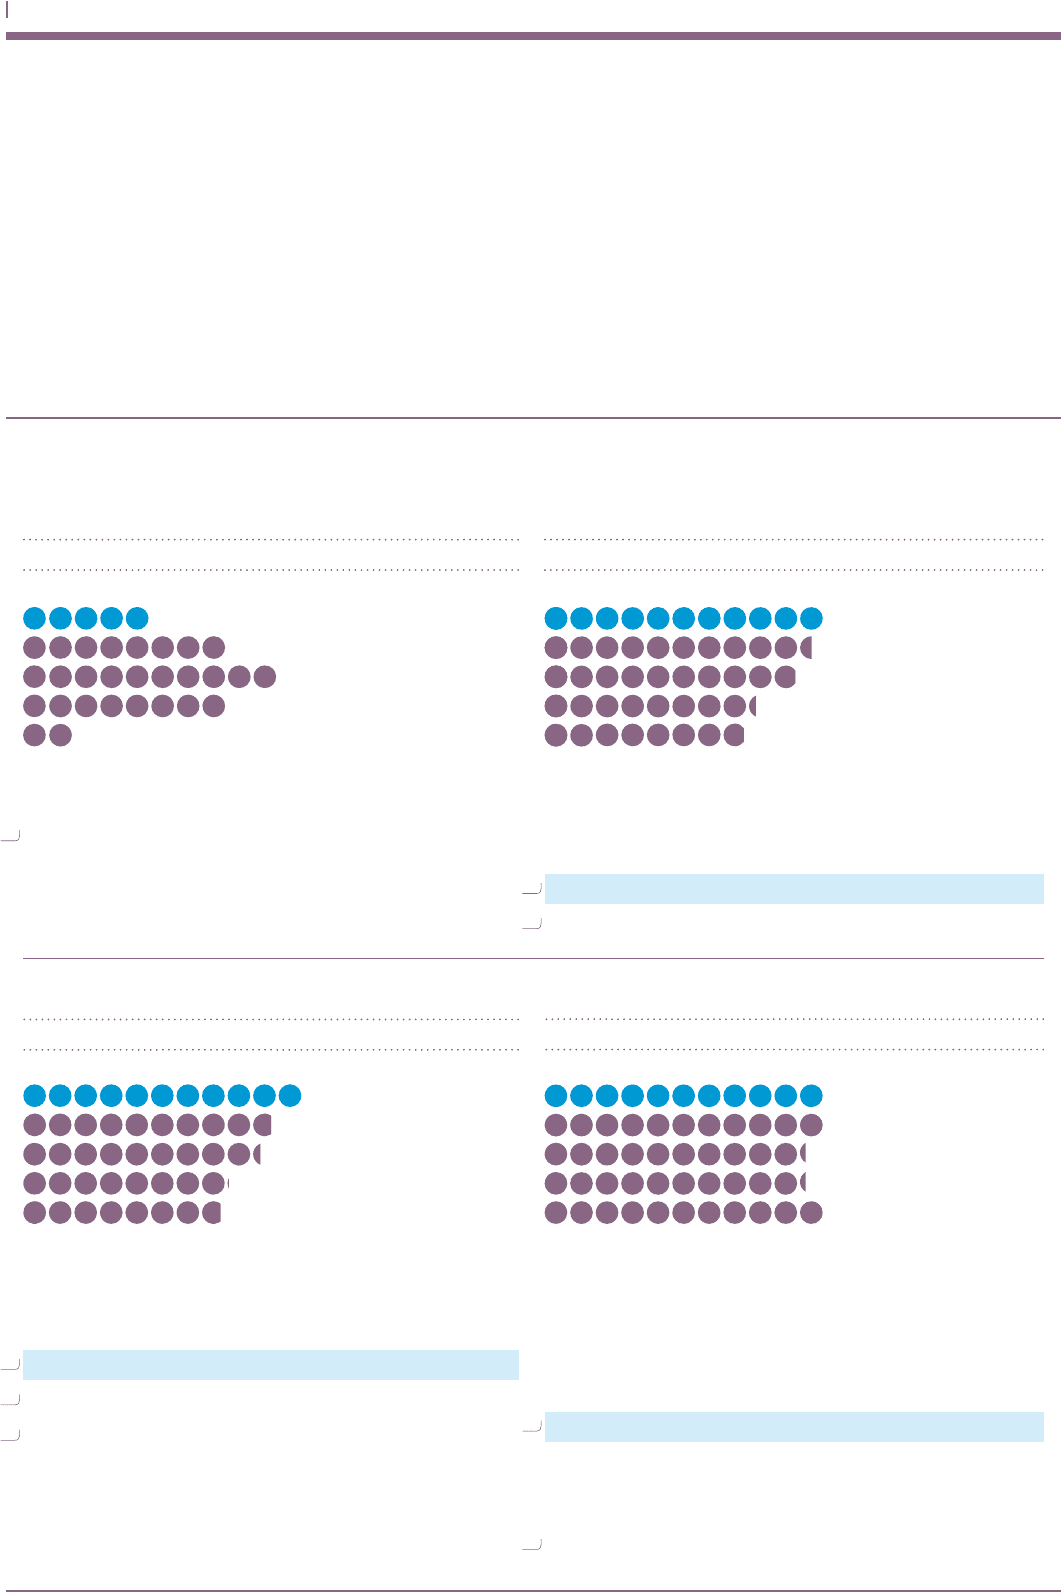
FINANCIAL
Organic revenue increased by 5% this year, with
growth coming from all regions and business lines.
See note 7 to the Group financial statements for definition of organic
revenue growth.
Aim: To deliver mid-to-high single digit
organic revenue growth
Organic revenue growth
The nature of our business model means that we generate
strong operating cash flow as a proportion of EBIT. This year we
converted 101% of EBIT into operating cash flow, which itself
increased 12% to US$1,321m.
Cumulative operating cash flow is a directors’ remuneration measure.
See note 7 to the Group financial statements for definition of operating cash flow
and cash flow conversion.
For additional information on cash flow see the Group cash flow statement.
Aim: To convert at least 90% of EBIT into operating cash flow
Operating cash flow (US$m) and cash flow conversion (%)
2%
935 100%
98%
1,124
975
96%
1,175 94%
8%
10%
8%
5%
1,321 101%
This year total EBIT increased by 4% to US$1,306m, EBIT from
continuing activities increased 7% at constant exchange rates.
We improved our EBIT margin from continuing activities
30 basis points to 27.4%.
The directors’ remuneration measure of PBT derives from EBIT.
See note 7 to the Group financial statements for definition of EBIT.
Aim: To maintain or improve EBIT margin
EBIT (US$m) and EBIT margin (%)
935 24.5%
25.7%
1,175
991
26.2%
1,251 27.1%
1,306 27.4%
16%
15%
15%
16%
16%
Aim: To generate and preserve value for our shareholders
Return on capital employed (‘ROCE’)
ROCE measures the return generated on the capital we
have invested in the business and reflects our ability to add
shareholder value over the long term. We have updated our
ROCE measure in the year to reflect a more commonly used
definition of return. This year ROCE has not increased, primarily
reflecting recent acquisitions where return rates are typically
lower in the early years of ownership.
ROCE is a directors’ remuneration measure.
We now define ROCE as EBIT less tax at the Benchmark rate divided by a 3 point
average of capital employed over the period, adjusted for non-controlling interests.
All comparatives have been updated on a consistent basis. Under the old
methodology we’d have reported a ROCE of 15% (2013 15%, 2012 to 2010 14%).
See note 7 to the Group financial statements for definition of capital employed.
1010
1212
1111
1414
1313
10
12
11
14
13
10
12
11
14
13
P118
P87
P118
P118
P87
P118
P109
P87