Experian 2014 Annual Report Download - page 43
Download and view the complete annual report
Please find page 43 of the 2014 Experian annual report below. You can navigate through the pages in the report by either clicking on the pages listed below, or by using the keyword search tool below to find specific information within the annual report.-
 1
1 -
2
-
3
-
4
-
5
-
6
-
7
-
8
-
9
-
10
-
11
-
12
-
13
-
14
-
15
-
16
-
17
-
18
-
19
-
20
-
21
-
22
-
23
-
24
-
25
-
26
-
27
-
28
-
29
-
30
-
31
-
32
-
 33
33 -
 34
34 -
 35
35 -
 36
36 -
 37
37 -
 38
38 -
 39
39 -
 40
40 -
 41
41 -
 42
42 -
 43
43 -
 44
44 -
 45
45 -
 46
46 -
 47
47 -
 48
48 -
 49
49 -
 50
50 -
 51
51 -
 52
52 -
 53
53 -
54
-
55
-
56
-
57
-
58
-
59
-
60
-
61
-
62
-
63
-
64
-
65
-
66
-
67
-
68
-
69
-
70
-
71
-
72
-
73
-
74
-
75
-
76
-
77
-
78
-
79
-
80
-
81
-
82
-
83
-
84
-
85
-
86
-
87
-
88
-
89
-
90
-
91
-
92
-
93
-
94
-
95
-
96
-
97
-
98
-
99
-
100
-
101
-
102
-
103
-
104
-
105
-
106
-
107
-
108
-
109
-
110
-
111
-
112
-
113
-
114
-
115
-
116
-
117
-
118
-
119
-
120
-
121
-
122
-
123
-
124
-
125
-
126
-
127
-
128
-
129
-
130
-
131
-
132
-
133
-
134
-
135
-
136
-
137
-
138
-
139
-
140
-
141
-
142
-
143
-
144
-
145
-
146
-
147
-
148
-
149
-
150
-
151
-
152
-
153
-
154
-
155
-
156
-
157
-
158
-
159
-
160
-
161
-
162
-
163
-
164
-
165
-
166
-
167
-
168
-
169
-
170
-
171
-
172
-
173
-
174
-
175
-
176
-
177
-
178
 |
 |
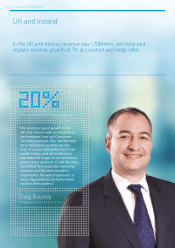
Strategic report • UK and Ireland
Credit Services
Total and organic revenue growth at
constant exchange rates was 3%. During
the year, Credit Services benefitted from
gradually improving volumes and the
introduction of new products. We saw
strength across consumer information,
where we have benefitted from increased
credit origination activity amongst
traditional lenders, engagements with
new entrants in the banking market and
growth across non-financial customers.
Business information had a more mixed
year, which we are addressing through
a number of initiatives, including the
introduction of new products and
expansion of the small and medium
enterprise channel.
Decision Analytics
Total and organic revenue growth at
constant exchange rates was 4% and
3% respectively. In Decision Analytics,
momentum improved as the year
progressed as large organisations started
to invest more in updating core systems.
We secured a number of major client
wins for credit risk management software,
including our first major deal in the UK
and Ireland for PowerCurve originations.
We also saw further traction in identity
management and fraud prevention
services. More recently, we have added
device identification from 41st Parameter
to our product range, and we were
pleased to secure a major client win in the
insurance sector after the year end.
Marketing Services
Total and organic revenue growth was
1% at constant exchange rates. During
the year we focused on developing a
more integrated approach to Marketing
Services in the UK and Ireland, bundling
our services in order to create a more
comprehensive offer for our clients
across channels. This has delivered
demonstrable benefits, as we have
secured new client wins, with a good
pipeline of similar future prospects.
Consumer Services
Consumer Services performed strongly,
with total and organic revenue growth
of 23% at constant exchange rates.
Growth reflected new member growth
and improved member retention as
we continue to build our brand in the
UK, where we have benefitted from a
significant uplift in consumer recognition,
and as we add new features and
enhancements to increase the attraction
of the membership service and to
encourage loyalty.
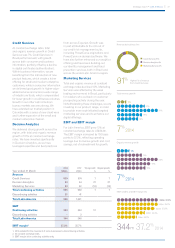
EBIT and EBIT margin
For the UK and Ireland, EBIT from
continuing activities was US$284m, up
14% at constant exchange rates. EBIT
margin increased by 190 basis points to
30.1%, reflecting operating leverage due
to revenue growth as well as cost savings,
net of reinvestments.
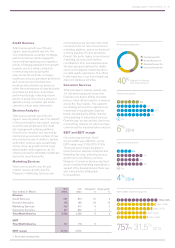
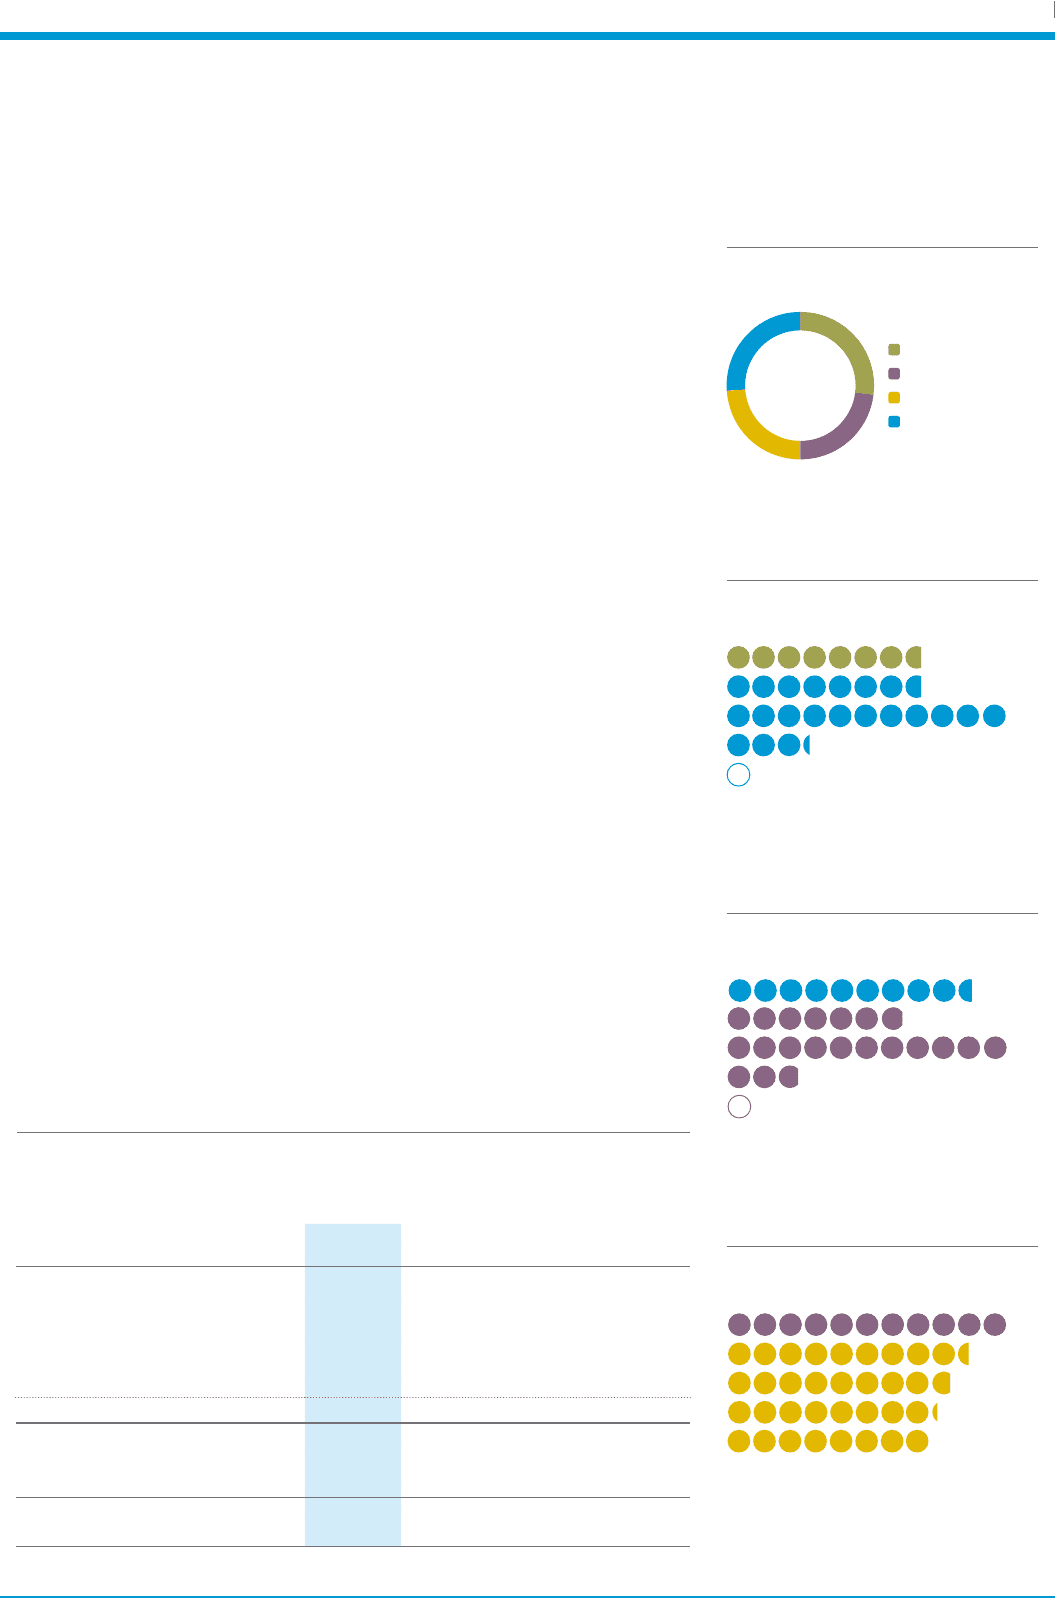
27%
Credit Services 27%
Decision Analytics 23%
Marketing Services 24%
Consumer Services 26%
Highest % of revenue
from Credit Services
Year ended 31 March
2014
US$m
2013
US$m
Total grow th1
%
Organic growth
1
%
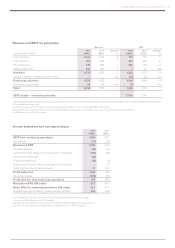
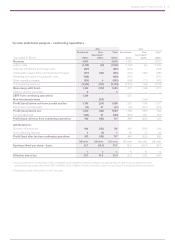
Revenue
Credit Services 257 248 3 3
Decision Analytics 217 206 4 3
Marketing Services 230 226 1 1
Consumer Services 240 193 23 23
Total UK and Ireland 944 873 7 7
EBIT
Total UK and Ireland 284 246 14
EBIT margin 30.1% 28.2%
1. At constant exchange rates.
284m 30.1% 2014
7% 2014
7% 2014
(1)%
7%
3%
10%
7%
10
12
11
13
14
246m 28.2%
27.5%
29.3%
28.1%
227m
205m
214m
284m 30.1%
10
12
11
13
14
(1)%
2%
8%
5%
7%
10
12
11
13
14
39
EBIT (US$m) and EBIT margin (%)
Revenue by business line
Total revenue growth
Organic revenue growth