Experian 2014 Annual Report Download - page 111
Download and view the complete annual report
Please find page 111 of the 2014 Experian annual report below. You can navigate through the pages in the report by either clicking on the pages listed below, or by using the keyword search tool below to find specific information within the annual report.-
 1
1 -
2
-
3
-
4
-
5
-
6
-
7
-
8
-
9
-
10
-
11
-
12
-
13
-
14
-
15
-
16
-
17
-
18
-
19
-
20
-
21
-
22
-
23
-
24
-
25
-
26
-
27
-
28
-
29
-
30
-
31
-
32
-
33
-
34
-
35
-
36
-
37
-
38
-
39
-
40
-
41
-
42
-
43
-
44
-
45
-
46
-
47
-
48
-
49
-
50
-
51
-
52
-
53
-
54
-
55
-
56
-
57
-
58
-
59
-
60
-
61
-
62
-
63
-
64
-
65
-
66
-
67
-
68
-
69
-
70
-
71
-
72
-
73
-
74
-
75
-
76
-
77
-
78
-
79
-
80
-
81
-
82
-
83
-
84
-
85
-
86
-
87
-
88
-
89
-
90
-
91
-
92
-
93
-
94
-
95
-
96
-
97
-
98
-
99
-
100
-
 101
101 -
 102
102 -
 103
103 -
 104
104 -
 105
105 -
 106
106 -
 107
107 -
 108
108 -
 109
109 -
 110
110 -
 111
111 -
 112
112 -
 113
113 -
 114
114 -
 115
115 -
 116
116 -
 117
117 -
 118
118 -
 119
119 -
 120
120 -
 121
121 -
122
-
123
-
124
-
125
-
126
-
127
-
128
-
129
-
130
-
131
-
132
-
133
-
134
-
135
-
136
-
137
-
138
-
139
-
140
-
141
-
142
-
143
-
144
-
145
-
146
-
147
-
148
-
149
-
150
-
151
-
152
-
153
-
154
-
155
-
156
-
157
-
158
-
159
-
160
-
161
-
162
-
163
-
164
-
165
-
166
-
167
-
168
-
169
-
170
-
171
-
172
-
173
-
174
-
175
-
176
-
177
-
178
 |
 |

107
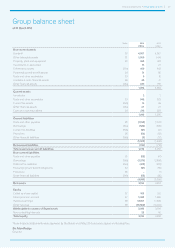
Financial statements • Group balance sheet
Group balance sheet
at 31 March 2014
Notes 2014
US$m
2013
US$m
Non-current assets
Goodwill 20 4,807 4,057
Other intangible assets 21 1,869 1,474
Property, plant and equipment 22 469 478
Investments in associates 13 21
Deferred tax assets 35(a) 460 643
Post-employment benefit assets 34 74 80
Trade and other receivables 23 9 10
Available-for-sale financial assets 28 46 41
Other financial assets 29(a) 229 156
7,976 6,960
Current assets
Inventories 2 7
Trade and other receivables 23 942 923
Current tax assets 35(b) 13 49
Other financial assets 29(a) 27 27
Cash and cash equivalents 24 212 229
1,196 1,235
Current liabilities
Trade and other payables 25 (1,168) (1,197)
Borrowings 26(a) (584) (635)
Current tax liabilities 35(b) (91) (41)
Provisions 36 (54) (52)
Other financial liabilities 29(a) (5) (20)
(1,902) (1,945)
Net current liabilities (706) (710)
Total assets less current liabilities 7,270 6,250
Non-current liabilities
Trade and other payables 25 (52) (41)
Borrowings 26(a) (3,576) (2,626)
Deferred tax liabilities 35(a) (412) (222)
Post-employment benefit obligations 34 (61) (56)
Provisions 36 –(1)
Other financial liabilities 29(a) (65) (80)
(4,166) (3,026)
Net assets 3,104 3,224
Equity
Called up share capital 37 103 102
Share premium account 37 1,492 1,480
Retained earnings 38 18,167 17,849
Other reserves 38 (16,680) (16,247)
Attributable to owners of Experian plc 3,082 3,184
Non-controlling interests 22 40
Tot al equity 3,104 3,224
These financial statements were approved by the Board on 6 May 2014 and were signed on its behalf by:
Sir Alan Rudge
Director