Experian 2014 Annual Report Download - page 140
Download and view the complete annual report
Please find page 140 of the 2014 Experian annual report below. You can navigate through the pages in the report by either clicking on the pages listed below, or by using the keyword search tool below to find specific information within the annual report.-
 1
1 -
2
-
3
-
4
-
5
-
6
-
7
-
8
-
9
-
10
-
11
-
12
-
13
-
14
-
15
-
16
-
17
-
18
-
19
-
20
-
21
-
22
-
23
-
24
-
25
-
26
-
27
-
28
-
29
-
30
-
31
-
32
-
33
-
34
-
35
-
36
-
37
-
38
-
39
-
40
-
41
-
42
-
43
-
44
-
45
-
46
-
47
-
48
-
49
-
50
-
51
-
52
-
53
-
54
-
55
-
56
-
57
-
58
-
59
-
60
-
61
-
62
-
63
-
64
-
65
-
66
-
67
-
68
-
69
-
70
-
71
-
72
-
73
-
74
-
75
-
76
-
77
-
78
-
79
-
80
-
81
-
82
-
83
-
84
-
85
-
86
-
87
-
88
-
89
-
90
-
91
-
92
-
93
-
94
-
95
-
96
-
97
-
98
-
99
-
100
-
101
-
102
-
103
-
104
-
105
-
106
-
107
-
108
-
109
-
110
-
111
-
112
-
113
-
114
-
115
-
116
-
117
-
118
-
119
-
120
-
121
-
122
-
123
-
124
-
125
-
126
-
127
-
128
-
129
-
 130
130 -
 131
131 -
 132
132 -
 133
133 -
 134
134 -
 135
135 -
 136
136 -
 137
137 -
 138
138 -
 139
139 -
 140
140 -
 141
141 -
 142
142 -
 143
143 -
 144
144 -
 145
145 -
 146
146 -
 147
147 -
 148
148 -
 149
149 -
 150
150 -
151
-
152
-
153
-
154
-
155
-
156
-
157
-
158
-
159
-
160
-
161
-
162
-
163
-
164
-
165
-
166
-
167
-
168
-
169
-
170
-
171
-
172
-
173
-
174
-
175
-
176
-
177
-
178
 |
 |

Financial statements • Notes to the Group financial statements
Notes to the Group financial statements
for the year ended 31 March 2014 continued
136
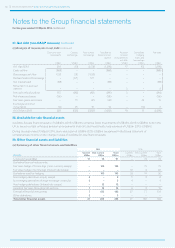
22. Property, plant and equipment
Freehold
properties
US$m
Short
leasehold
properties
US$m
Plant and
equipment
US$m
Total
US$m
Cost
At 1 April 2013 240 149 532 921
Differences on exchange 8 (1) 8 15
Additions through business combinations (note 40) – 1 12 13
Other additions 1 3 79 83
Disposal of subsidiaries – (1) (5) (6)
Other disposals (23) (1) (112) (136)
At 31 March 2014 226 150 514 890
Accumulated depreciation
At 1 April 2013 69 49 325 443
Differences on exchange 2 – 5 7
Charge for the year 11 9 82 102
Disposal of subsidiaries – (1) (4) (5)
Other disposals (15) (1) (110) (126)
At 31 March 2014 67 56 298 421
Net book amount at 31 March 2013 171 100 207 478
Net book amount at 31 March 2014 159 94 216 469
Freehold
properties
US$m
Short
leasehold
properties
US$m
Plant and
equipment
US$m
Total
US$m
Cost
At 1 April 2012 253 137 494 884
Differences on exchange (13) – (14) (27)
Other additions 1 12 102 115
Disposal of subsidiaries – – (3) (3)
Other disposals (1) – (47) (48)
At 31 March 2013 240 149 532 921
Accumulated depreciation
At 1 April 2012 68 40 313 421
Differences on exchange (4) – (6) (10)
Charge for the year 6 9 66 81
Disposal of subsidiaries – – (3) (3)
Other disposals (1) – (45) (46)
At 31 March 2013 69 49 325 443
Net book amount at 31 March 2012 185 97 181 463
Net book amount at 31 March 2013 171 100 207 478
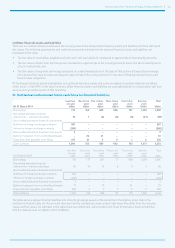
The net book amount of assets held under finance lease agreements and capitalised in plant and equipment is US$4m (2013: S$6m).
Further leased assets of US$7m (2013: US$9m) are capitalised in other intangible assets.