Experian 2014 Annual Report Download - page 50
Download and view the complete annual report
Please find page 50 of the 2014 Experian annual report below. You can navigate through the pages in the report by either clicking on the pages listed below, or by using the keyword search tool below to find specific information within the annual report.-
 1
1 -
2
-
3
-
4
-
5
-
6
-
7
-
8
-
9
-
10
-
11
-
12
-
13
-
14
-
15
-
16
-
17
-
18
-
19
-
20
-
21
-
22
-
23
-
24
-
25
-
26
-
27
-
28
-
29
-
30
-
31
-
32
-
33
-
34
-
35
-
36
-
37
-
38
-
39
-
 40
40 -
 41
41 -
 42
42 -
 43
43 -
 44
44 -
 45
45 -
 46
46 -
 47
47 -
 48
48 -
 49
49 -
 50
50 -
 51
51 -
 52
52 -
 53
53 -
 54
54 -
 55
55 -
 56
56 -
 57
57 -
 58
58 -
 59
59 -
 60
60 -
61
-
62
-
63
-
64
-
65
-
66
-
67
-
68
-
69
-
70
-
71
-
72
-
73
-
74
-
75
-
76
-
77
-
78
-
79
-
80
-
81
-
82
-
83
-
84
-
85
-
86
-
87
-
88
-
89
-
90
-
91
-
92
-
93
-
94
-
95
-
96
-
97
-
98
-
99
-
100
-
101
-
102
-
103
-
104
-
105
-
106
-
107
-
108
-
109
-
110
-
111
-
112
-
113
-
114
-
115
-
116
-
117
-
118
-
119
-
120
-
121
-
122
-
123
-
124
-
125
-
126
-
127
-
128
-
129
-
130
-
131
-
132
-
133
-
134
-
135
-
136
-
137
-
138
-
139
-
140
-
141
-
142
-
143
-
144
-
145
-
146
-
147
-
148
-
149
-
150
-
151
-
152
-
153
-
154
-
155
-
156
-
157
-
158
-
159
-
160
-
161
-
162
-
163
-
164
-
165
-
166
-
167
-
168
-
169
-
170
-
171
-
172
-
173
-
174
-
175
-
176
-
177
-
178
 |
 |

46 Strategic report • Financial review
Group balance sheet commentary
Net assets
The net assets summary table analyses
our net assets and capital employed. We
monitor capital employed by operating
segment as part of our internal reporting,
and give further information by operating
segment in note 9(a)(ii) to the Group
financial statements. Capital employed
includes post-employment benefit assets
of US$13m (2013: US$24m) and net
derivative financial assets of US$138m
(2013: US$59m) where the balance sheet
values depend on market conditions.
Total equit y
A reconciliation of the movement in
Group total equity is given in the summary
reconciliation of total equity table with
two items worthy of further comment:
• Currency translation losses of
US$188m (2013: US$39m) arise
mainly from the weakening of the
Brazilian real against the US dollar.
• The net movement from transactions
with non-controlling interests in
the year ended 31 March 2013
of US$427m, reported within
transactions with owners, principally
related to our recognition of a
deferred tax asset on the acquisition
of the further stake in Serasa.
Other items
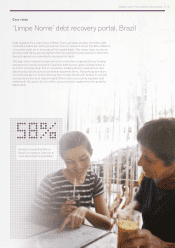
The Group has continued to receive a
significant number of claims in Brazil
throughout the year, primarily in three
states, relating to the disclosure and use
of credit scores. The cases are mainly
individual small claims and also include
a small number of class actions. Similar
proceedings have been commenced
against other suppliers of credit scores
in Brazil. The Superior Tribunal of Justice
(‘STJ’), the highest court in Brazil for
such cases, has issued a stay on all
proceedings relating to these claims while
it determines the principal legal issues
involved. The Group does not believe the
claims have merit under Brazilian law and
will continue to vigorously defend them.
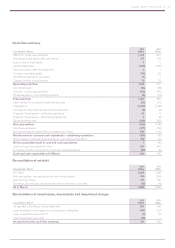
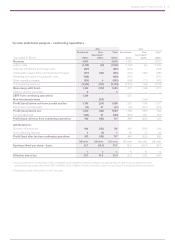
Net assets summary
At 31 March
2014
US$m
2013
US$m
Goodwill 4,807 4,057
Other intangible assets 1,869 1,474
Other segment assets 1,380 1,384
Total segment assets 8,056 6,915
Segment liabilities (1,289) (1,307)
Operating segments – net assets 6,767 5,608
Central Activities – net assets 176 125
Deduct: non-controlling interests (22) (40)
Capital employed 6,921 5,693
Net debt (3,809) (2,938)
Tax (30) 429
Add: non-controlling interests 22 40
Net assets 3,104 3,224
US$ US$
Net assets per share 3.18 3.26
Summary reconciliation of total equity
Year ended 31 March
2014
US$m
2013
US$m
Profit for the financial year 754 401
Remeasurement loss on post-employment benefits (10) (43)
Other – principally currency translation losses (185) (36)
Total comprehensive income for the financial year 559 322
Transactions with owners:
Net movement for employee share incentive plans and
treasury shares (296) (80)
Net movement from transactions with non-controlling
interests (28) 427
Dividends paid (355) (376)
(Decrease)/increase in total equity (120) 293
At 1 April 3,224 2,931
At 31 March 3,104 3,224
Foreign exchange – closing rates
The table below shows the principal exchange rates used to translate assets and
liabilities at the balance sheet dates.
At 31 March 2014 2013
US$ : Brazilian real 2.27 2.02
Sterling : US$ 1.66 1.52
Euro : US$ 1.38 1.28
Financial review continued
P122