Experian 2014 Annual Report Download - page 128
Download and view the complete annual report
Please find page 128 of the 2014 Experian annual report below. You can navigate through the pages in the report by either clicking on the pages listed below, or by using the keyword search tool below to find specific information within the annual report.-
 1
1 -
2
-
3
-
4
-
5
-
6
-
7
-
8
-
9
-
10
-
11
-
12
-
13
-
14
-
15
-
16
-
17
-
18
-
19
-
20
-
21
-
22
-
23
-
24
-
25
-
26
-
27
-
28
-
29
-
30
-
31
-
32
-
33
-
34
-
35
-
36
-
37
-
38
-
39
-
40
-
41
-
42
-
43
-
44
-
45
-
46
-
47
-
48
-
49
-
50
-
51
-
52
-
53
-
54
-
55
-
56
-
57
-
58
-
59
-
60
-
61
-
62
-
63
-
64
-
65
-
66
-
67
-
68
-
69
-
70
-
71
-
72
-
73
-
74
-
75
-
76
-
77
-
78
-
79
-
80
-
81
-
82
-
83
-
84
-
85
-
86
-
87
-
88
-
89
-
90
-
91
-
92
-
93
-
94
-
95
-
96
-
97
-
98
-
99
-
100
-
101
-
102
-
103
-
104
-
105
-
106
-
107
-
108
-
109
-
110
-
111
-
112
-
113
-
114
-
115
-
116
-
117
-
 118
118 -
 119
119 -
 120
120 -
 121
121 -
 122
122 -
 123
123 -
 124
124 -
 125
125 -
 126
126 -
 127
127 -
 128
128 -
 129
129 -
 130
130 -
 131
131 -
 132
132 -
 133
133 -
 134
134 -
 135
135 -
 136
136 -
 137
137 -
 138
138 -
139
-
140
-
141
-
142
-
143
-
144
-
145
-
146
-
147
-
148
-
149
-
150
-
151
-
152
-
153
-
154
-
155
-
156
-
157
-
158
-
159
-
160
-
161
-
162
-
163
-
164
-
165
-
166
-
167
-
168
-
169
-
170
-
171
-
172
-
173
-
174
-
175
-
176
-
177
-
178
 |
 |

Financial statements • Notes to the Group financial statements
Notes to the Group financial statements
for the year ended 31 March 2014 continued
124
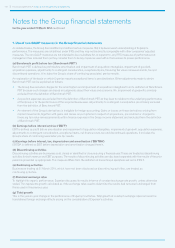
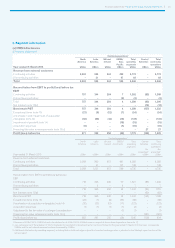
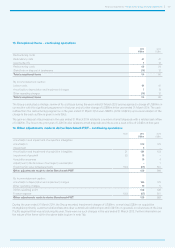
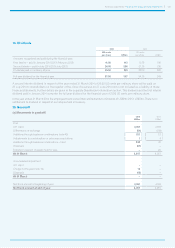
9. Segment information continued
(b) Information on business segments (including non-GAAP disclosures)
Year ended 31 March 2014
Continuing operations1
Credit
Services
US$m
Decision
Analytics
US$m
Marketing
Services
US$m
Consumer
Services
US$m
Total
business
segments
US$m
Central
Activities
US$m
Total
continuing
operations
US$m
Revenue from external customers
Continuing activities 2,244 576 881 1,071 4,772 – 4,772
Discontinuing activities – – 68 – 68 – 68
Tot al 2,244 576 949 1,071 4,840 – 4,840
Reconciliation from EBIT to profit/(loss) before tax
EBIT
Continuing activities 806 122 156 308 1,392 (83) 1,309
Discontinuing activities – – (3) – (3) – (3)
Total 806 122 153 308 1,389 (83) 1,306
Net interest (note 15(b)) – – – – – (74) (74)
Benchmark PBT 806 122 153 308 1,389 (157) 1,232
Exceptional items (note 13) (41) (10) – (3) (54) – (54)
Amortisation and impairment of acquisition
intangibles (note 14) (74) (11) (27) (19) (131) – (131)
Impairment of goodwill (note 14) – – (15) – (15) – (15)
Acquisition expenses (5) (4) (1) – (10) – (10)
Financing fair value remeasurements (note 15(c)) – – – – – 27 27
Profit/(loss) before tax 686 97 110 286 1,179 (130) 1,049
Year ended 31 March 2013
Continuing operations1
Credit
Services
US$m
Decision
Analytics
US$m
Marketing
Services
US$m
Consumer
Services
US$m
Total
business
segments
US$m
Central
Activities
Re-
presented2
US$m
Total
continuing
operations
Re-
presented2
US$m
Revenue from external customers
Continuing activities 2,181 512 874 1,015 4,582 – 4,582
Discontinuing activities 13 – 135 – 148 – 148
Total 2,194 512 1,009 1,015 4,730 – 4,730
Reconciliation from EBIT to profit/(loss) before tax
EBIT
Continuing activities 769 109 138 311 1,327 (83) 1,244
Discontinuing activities (1) – 8 – 7 – 7
Total 768 109 146 311 1,334 (83) 1,251
Net interest (note 15(b)) – – – – – (62) (62)
Benchmark PBT 768 109 146 311 1,334 (145) 1,189
Exceptional items (note 13) (29) (14) (20) (3) (66) – (66)
Amortisation of acquisition
intangibles (note 14) (71) (5) (28) (19) (123) – (123)
Acquisition expenses (2) (1) (1) – (4) – (4)
Adjustment to the fair value of
contingent consideration – – (1) – (1) – (1)
Financing fair value remeasurements (note 15(c)) – – – – – (561) (561)
Profit/(loss) before tax 666 89 96 289 1,140 (706) 434
1. Revenue of US$nil (2013: US$147m) and a loss before tax of US$nil (2013: US$5m) arose in respect of discontinued operations (see note 17).
2. As a consequence of the adoption of IAS 19 (revised), the loss before interest and tax for Central Activities for the year ended 31 March 2013 has been increased by
US$2m and the net interest expense has been increased by US$4m.
3. Additional information by business segment, including that on total and organic growth at constant exchange rates, is provided in the Strategic report section of the
annual report.