Experian 2014 Annual Report Download - page 148
Download and view the complete annual report
Please find page 148 of the 2014 Experian annual report below. You can navigate through the pages in the report by either clicking on the pages listed below, or by using the keyword search tool below to find specific information within the annual report.-
 1
1 -
2
-
3
-
4
-
5
-
6
-
7
-
8
-
9
-
10
-
11
-
12
-
13
-
14
-
15
-
16
-
17
-
18
-
19
-
20
-
21
-
22
-
23
-
24
-
25
-
26
-
27
-
28
-
29
-
30
-
31
-
32
-
33
-
34
-
35
-
36
-
37
-
38
-
39
-
40
-
41
-
42
-
43
-
44
-
45
-
46
-
47
-
48
-
49
-
50
-
51
-
52
-
53
-
54
-
55
-
56
-
57
-
58
-
59
-
60
-
61
-
62
-
63
-
64
-
65
-
66
-
67
-
68
-
69
-
70
-
71
-
72
-
73
-
74
-
75
-
76
-
77
-
78
-
79
-
80
-
81
-
82
-
83
-
84
-
85
-
86
-
87
-
88
-
89
-
90
-
91
-
92
-
93
-
94
-
95
-
96
-
97
-
98
-
99
-
100
-
101
-
102
-
103
-
104
-
105
-
106
-
107
-
108
-
109
-
110
-
111
-
112
-
113
-
114
-
115
-
116
-
117
-
118
-
119
-
120
-
121
-
122
-
123
-
124
-
125
-
126
-
127
-
128
-
129
-
130
-
131
-
132
-
133
-
134
-
135
-
136
-
137
-
 138
138 -
 139
139 -
 140
140 -
 141
141 -
 142
142 -
 143
143 -
 144
144 -
 145
145 -
 146
146 -
 147
147 -
 148
148 -
 149
149 -
 150
150 -
 151
151 -
 152
152 -
 153
153 -
 154
154 -
 155
155 -
 156
156 -
 157
157 -
 158
158 -
159
-
160
-
161
-
162
-
163
-
164
-
165
-
166
-
167
-
168
-
169
-
170
-
171
-
172
-
173
-
174
-
175
-
176
-
177
-
178
 |
 |

Financial statements • Notes to the Group financial statements
Notes to the Group financial statements
for the year ended 31 March 2014 continued
144
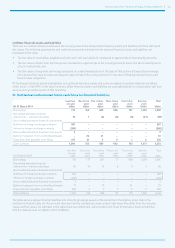
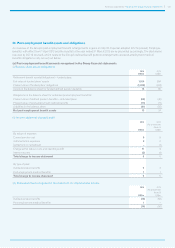
30. Fair values of financial assets and liabilities
(a) Analysis by valuation method for items measured at fair value
2014 2013
Level 1
US$m
Level 2
US$m
Level 3
US$m
Total
US$m
Level 1
US$m
Level 2
US$m
Level 3
US$m
Total
US$m
Financial assets:
Derivatives used for hedging – 143 – 143 – 92 – 92
Assets at fair value
through profit and loss – 22 – 22 – 12 – 12
Amounts reported as other
financial assets (note 29) – 165 – 165 – 104 – 104
Available-for-sale (note 28) 43 – 3 46 38 – 3 41
43 165 3 211 38 104 3 145
Financial liabilities:
Derivatives used for hedging – (1) – (1) – – – –
Liabilities at fair value
through profit and loss – (25) (44) (69) – (45) (55) (100)
– (26) (44) (70) – (45) (55) (100)
Net financial assets/(liabilities) 43 139 (41) 141 38 59 (52) 45
The analysis by level is a requirement of IFRS 13 ‘Fair value measurement’; the levels are defined therein and summarised here
for completeness. Assets and liabilities whose valuations are based on unadjusted quoted prices in active markets for identical
assets and liabilities are classified as Level 1. Assets and liabilities which are not traded in an active market and whose valuations
are derived from available market data that is observable for the asset or liability are classified as Level 2. Assets and liabilities
whose valuations are derived from inputs not based on observable market data are classified as Level 3. For Experian, Level 3 items
principally comprise put and call options associated with corporate transactions with no material effect on the amounts stated from
any reasonably possible change in Level 3 inputs at 31 March 2014.
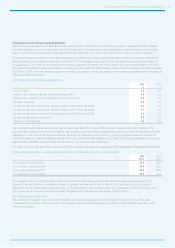
(b) Analysis of movements in Level 3 assets and liabilities
Year ended 31 March 2014 Year ended 31 March 2013
Available-for-
sale
US$m
Other
US$m
Total
US$m
Available-for-
sale
US$m
Serasa put
option
US$m
Other
US$m
Total
US$m
At 1 April 3 (55) (52) – (1,092) (26) (1,118)
Additions and reclassifications – – – 3 – (24) (21)
Valuation losses recognised in
Group income statement – 13 13 – (558) (5) (563)
Currency translation gains
recognised directly in other
comprehensive income – (2) (2) – 163 – 163
De-recognition of put option
liability directly in equity – – – – 1,487 – 1,487
At 31 March 3 (44) (41) 3 – (55) (52)