Experian 2014 Annual Report Download - page 49
Download and view the complete annual report
Please find page 49 of the 2014 Experian annual report below. You can navigate through the pages in the report by either clicking on the pages listed below, or by using the keyword search tool below to find specific information within the annual report.-
 1
1 -
2
-
3
-
4
-
5
-
6
-
7
-
8
-
9
-
10
-
11
-
12
-
13
-
14
-
15
-
16
-
17
-
18
-
19
-
20
-
21
-
22
-
23
-
24
-
25
-
26
-
27
-
28
-
29
-
30
-
31
-
32
-
33
-
34
-
35
-
36
-
37
-
38
-
 39
39 -
 40
40 -
 41
41 -
 42
42 -
 43
43 -
 44
44 -
 45
45 -
 46
46 -
 47
47 -
 48
48 -
 49
49 -
 50
50 -
 51
51 -
 52
52 -
 53
53 -
 54
54 -
 55
55 -
 56
56 -
 57
57 -
 58
58 -
 59
59 -
60
-
61
-
62
-
63
-
64
-
65
-
66
-
67
-
68
-
69
-
70
-
71
-
72
-
73
-
74
-
75
-
76
-
77
-
78
-
79
-
80
-
81
-
82
-
83
-
84
-
85
-
86
-
87
-
88
-
89
-
90
-
91
-
92
-
93
-
94
-
95
-
96
-
97
-
98
-
99
-
100
-
101
-
102
-
103
-
104
-
105
-
106
-
107
-
108
-
109
-
110
-
111
-
112
-
113
-
114
-
115
-
116
-
117
-
118
-
119
-
120
-
121
-
122
-
123
-
124
-
125
-
126
-
127
-
128
-
129
-
130
-
131
-
132
-
133
-
134
-
135
-
136
-
137
-
138
-
139
-
140
-
141
-
142
-
143
-
144
-
145
-
146
-
147
-
148
-
149
-
150
-
151
-
152
-
153
-
154
-
155
-
156
-
157
-
158
-
159
-
160
-
161
-
162
-
163
-
164
-
165
-
166
-
167
-
168
-
169
-
170
-
171
-
172
-
173
-
174
-
175
-
176
-
177
-
178
 |
 |

45
Strategic report • Financial review
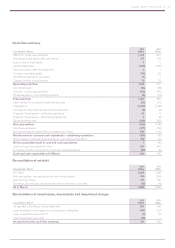
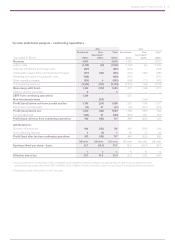
Cash flow summary
Year ended 31 March
2014
US$m
2013
US$m
EBIT from continuing operations 1,306 1,251
Amortisation and depreciation (see below) 371 329
Loss on sale of fixed assets 52
Capital expenditure (402) (460)
Sale of property, plant and equipment 81
Increase in working capital (36) (27)
(Profit)/loss retained in associates (1) 1
Charge for share incentive plans 70 78
Operating cash flow 1,321 1,175
Net interest paid (74) (68)
Tax paid – continuing operations (174) (162)
Dividends paid to non-controlling interests (6) (54)
Free cash flow 1,067 891
Cash outflow for exceptional restructuring costs (65) (27)
Acquisitions (1,250) (1,549)
Purchase of other financial assets and investments (3) (8)
Disposal of businesses – continuing operations 25 5
Disposal of businesses – discontinued operations 5(8)
Equity dividends paid (349) (322)
Net cash outflow (570) (1,018)
Net share purchases (371) (180)
New borrowings and other financing related cash flows 808 1,118
Net decrease in cash and cash equivalents – continuing operations (133) (80)
Net increase in cash and cash equivalents – discontinued operations 140 64
Net increase/(decrease) in cash and cash equivalents 7(16)
Cash and cash equivalents at 1 April 226 254
Exchange and other movements in cash and cash equivalents (25) (12)
Cash and cash equivalents at 31 March 208 226
Reconciliation of net debt
Year ended 31 March
2014
US$m
2013
US$m
At 1 April 2,938 1,818
Net cash outflow – as reported in the cash flow summary 570 1,018
Net share purchases 371 180
Exchange, discontinued operations and other movements in net debt (70) (78)
At 31 March 3,809 2,938
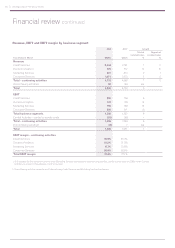
Reconciliation of amortisation, depreciation and impairment charges
Year ended 31 March
2014
US$m
2013
US$m
As reported in the Group income statement 524 465
Less: amortisation and impairment of acquisition intangibles (131) (123)
Less: exceptional asset write-off (7) (13)
Less: impairment of goodwill (15) –
As reported in the cash flow summary 371 329