Experian 2014 Annual Report Download - page 130
Download and view the complete annual report
Please find page 130 of the 2014 Experian annual report below. You can navigate through the pages in the report by either clicking on the pages listed below, or by using the keyword search tool below to find specific information within the annual report.-
 1
1 -
2
-
3
-
4
-
5
-
6
-
7
-
8
-
9
-
10
-
11
-
12
-
13
-
14
-
15
-
16
-
17
-
18
-
19
-
20
-
21
-
22
-
23
-
24
-
25
-
26
-
27
-
28
-
29
-
30
-
31
-
32
-
33
-
34
-
35
-
36
-
37
-
38
-
39
-
40
-
41
-
42
-
43
-
44
-
45
-
46
-
47
-
48
-
49
-
50
-
51
-
52
-
53
-
54
-
55
-
56
-
57
-
58
-
59
-
60
-
61
-
62
-
63
-
64
-
65
-
66
-
67
-
68
-
69
-
70
-
71
-
72
-
73
-
74
-
75
-
76
-
77
-
78
-
79
-
80
-
81
-
82
-
83
-
84
-
85
-
86
-
87
-
88
-
89
-
90
-
91
-
92
-
93
-
94
-
95
-
96
-
97
-
98
-
99
-
100
-
101
-
102
-
103
-
104
-
105
-
106
-
107
-
108
-
109
-
110
-
111
-
112
-
113
-
114
-
115
-
116
-
117
-
118
-
119
-
 120
120 -
 121
121 -
 122
122 -
 123
123 -
 124
124 -
 125
125 -
 126
126 -
 127
127 -
 128
128 -
 129
129 -
 130
130 -
 131
131 -
 132
132 -
 133
133 -
 134
134 -
 135
135 -
 136
136 -
 137
137 -
 138
138 -
 139
139 -
 140
140 -
141
-
142
-
143
-
144
-
145
-
146
-
147
-
148
-
149
-
150
-
151
-
152
-
153
-
154
-
155
-
156
-
157
-
158
-
159
-
160
-
161
-
162
-
163
-
164
-
165
-
166
-
167
-
168
-
169
-
170
-
171
-
172
-
173
-
174
-
175
-
176
-
177
-
178
 |
 |

Financial statements • Notes to the Group financial statements
Notes to the Group financial statements
for the year ended 31 March 2014 continued
126
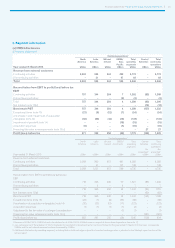
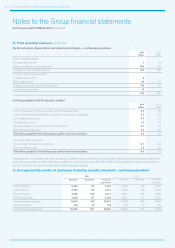
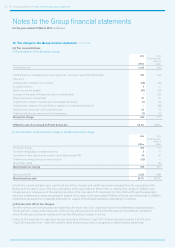
11. Total operating expenses continued
(b) Amortisation, depreciation and impairment charges – continuing operations
2014
US$m
2013
US$m
Other intangible assets:
Exceptional write-offs 1 13
Other amortisation and impairment 406 371
Charge for other intangible assets 407 384
Property, plant and equipment:
Exceptional write-offs 6–
Other depreciation 96 81
Charge for property, plant and equipment 102 81
Impairment of goodwill 15 –
524 465
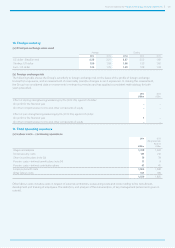
(c) Fees payable to the Company’s auditor
2014
US$m
2013
US$m
Audit of the parent company and Group financial statements 0.5 0.5
Audit of the financial statements of the parent company’s subsidiaries 3.3 3.3
Tax compliance services 0.3 0.4
Tax advisory services 1.5 1.8
Services relating to corporate finance transactions 0.1 0.2
Other assurance services 0.9 1.0
Total fees payable to the Company’s auditor and its associates 6.6 7.2
Summary of fees by nature:
Fees for audit and assurance services 4.7 4.8
Fees for other services 1.9 2.4
Total fees payable to the Company’s auditor and its associates 6.6 7.2
The guidelines covering the use of the Company’s auditor for non-audit services are set out in the Corporate governance statement
and in the year ended 31 March 2014 fees payable for such services were 40% (2013: 50%) of fees payable for audit and assurance
services. All such fees are included within other operating charges.
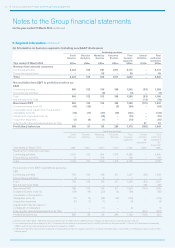
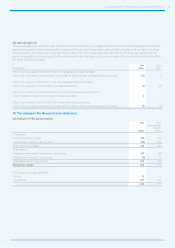
12. Average monthly number of employees (including executive directors) – continuing operations
2014 2013
Full time Part time Full time
equivalent
Full time Part time Full time
equivalent
North America 6,352 56 6,381 5,879 66 5,912
Latin America 3,256 113 3,312 3,428 118 3,487
UK and Ireland 3,348 259 3,477 3,445 287 3,588
EMEA/Asia Pacific 3,458 87 3,502 3,951 111 4,007
Total operating segments 16,414 515 16,672 16,703 582 16,994
Central Activities 142 12 148 120 9 125
Total continuing operations 16,556 527 16,820 16,823 591 17,119