Experian 2014 Annual Report Download - page 127
Download and view the complete annual report
Please find page 127 of the 2014 Experian annual report below. You can navigate through the pages in the report by either clicking on the pages listed below, or by using the keyword search tool below to find specific information within the annual report.-
 1
1 -
2
-
3
-
4
-
5
-
6
-
7
-
8
-
9
-
10
-
11
-
12
-
13
-
14
-
15
-
16
-
17
-
18
-
19
-
20
-
21
-
22
-
23
-
24
-
25
-
26
-
27
-
28
-
29
-
30
-
31
-
32
-
33
-
34
-
35
-
36
-
37
-
38
-
39
-
40
-
41
-
42
-
43
-
44
-
45
-
46
-
47
-
48
-
49
-
50
-
51
-
52
-
53
-
54
-
55
-
56
-
57
-
58
-
59
-
60
-
61
-
62
-
63
-
64
-
65
-
66
-
67
-
68
-
69
-
70
-
71
-
72
-
73
-
74
-
75
-
76
-
77
-
78
-
79
-
80
-
81
-
82
-
83
-
84
-
85
-
86
-
87
-
88
-
89
-
90
-
91
-
92
-
93
-
94
-
95
-
96
-
97
-
98
-
99
-
100
-
101
-
102
-
103
-
104
-
105
-
106
-
107
-
108
-
109
-
110
-
111
-
112
-
113
-
114
-
115
-
116
-
 117
117 -
 118
118 -
 119
119 -
 120
120 -
 121
121 -
 122
122 -
 123
123 -
 124
124 -
 125
125 -
 126
126 -
 127
127 -
 128
128 -
 129
129 -
 130
130 -
 131
131 -
 132
132 -
 133
133 -
 134
134 -
 135
135 -
 136
136 -
 137
137 -
138
-
139
-
140
-
141
-
142
-
143
-
144
-
145
-
146
-
147
-
148
-
149
-
150
-
151
-
152
-
153
-
154
-
155
-
156
-
157
-
158
-
159
-
160
-
161
-
162
-
163
-
164
-
165
-
166
-
167
-
168
-
169
-
170
-
171
-
172
-
173
-
174
-
175
-
176
-
177
-
178
 |
 |

Financial statements • Notes to the Group financial statements 123
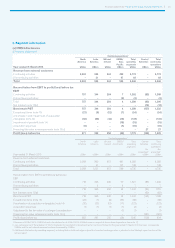
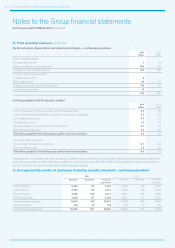
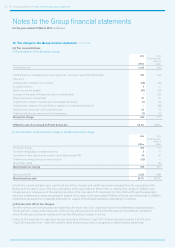
(iii) Capital expenditure, amortisation and depreciation
Capital expenditure Amortisation Depreciation
2014
US$m
2013
US$m
2014
US$m
2013
US$m
2014
US$m
2013
US$m
North America 158 181 109 97 47 36
Latin America 103 116 74 69 14 15
UK and Ireland 57 78 33 33 21 18
EMEA/Asia Pacific 51 58 35 34 11 10
Total operating segments 369 433 251 233 93 79
Central Activities 33 27 24 15 32
Total Group 402 460 275 248 96 81
Amortisation and depreciation in the above analysis only includes amounts charged to Benchmark PBT.
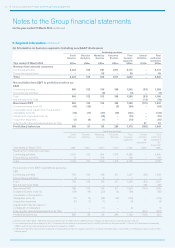
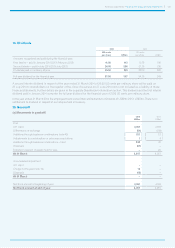
(iv) Revenue by country – continuing operations
2014
US$m
2013
US$m
USA 2,391 2,255
Brazil 819 866
UK 936 865
Colombia 94 111
Other 600 633
4,840 4,730
The Company is resident in Ireland and, as revenue with Irish external customers is less than 1% of the Group’s revenue from external
customers, the Group’s revenue is primarily attributable to foreign countries. No single customer accounted for 10% or more of the
Group’s revenue in the current or prior year.
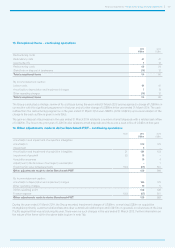
(v) Non-current assets by country
2014
US$m
2013
US$m
USA 3,820 2,638
Brazil 1,327 1,450
UK 1,051 985
Colombia 364 425
Other 657 607
Segment non-current assets by country 7,219 6,105
Central Activities 297 212
Deferred tax 460 643
7,976 6,960
Non-current assets for Central Activities and deferred tax have been excluded from the analysis by country to add clarity to the
presentation of this information. The Group has no significant non-current assets located in Ireland.