Experian 2014 Annual Report Download - page 160
Download and view the complete annual report
Please find page 160 of the 2014 Experian annual report below. You can navigate through the pages in the report by either clicking on the pages listed below, or by using the keyword search tool below to find specific information within the annual report.-
 1
1 -
2
-
3
-
4
-
5
-
6
-
7
-
8
-
9
-
10
-
11
-
12
-
13
-
14
-
15
-
16
-
17
-
18
-
19
-
20
-
21
-
22
-
23
-
24
-
25
-
26
-
27
-
28
-
29
-
30
-
31
-
32
-
33
-
34
-
35
-
36
-
37
-
38
-
39
-
40
-
41
-
42
-
43
-
44
-
45
-
46
-
47
-
48
-
49
-
50
-
51
-
52
-
53
-
54
-
55
-
56
-
57
-
58
-
59
-
60
-
61
-
62
-
63
-
64
-
65
-
66
-
67
-
68
-
69
-
70
-
71
-
72
-
73
-
74
-
75
-
76
-
77
-
78
-
79
-
80
-
81
-
82
-
83
-
84
-
85
-
86
-
87
-
88
-
89
-
90
-
91
-
92
-
93
-
94
-
95
-
96
-
97
-
98
-
99
-
100
-
101
-
102
-
103
-
104
-
105
-
106
-
107
-
108
-
109
-
110
-
111
-
112
-
113
-
114
-
115
-
116
-
117
-
118
-
119
-
120
-
121
-
122
-
123
-
124
-
125
-
126
-
127
-
128
-
129
-
130
-
131
-
132
-
133
-
134
-
135
-
136
-
137
-
138
-
139
-
140
-
141
-
142
-
143
-
144
-
145
-
146
-
147
-
148
-
149
-
 150
150 -
 151
151 -
 152
152 -
 153
153 -
 154
154 -
 155
155 -
 156
156 -
 157
157 -
 158
158 -
 159
159 -
 160
160 -
 161
161 -
 162
162 -
 163
163 -
 164
164 -
 165
165 -
 166
166 -
 167
167 -
 168
168 -
 169
169 -
 170
170 -
171
-
172
-
173
-
174
-
175
-
176
-
177
-
178
 |
 |

Financial statements • Notes to the Group financial statements
Notes to the Group financial statements
for the year ended 31 March 2014 continued
156
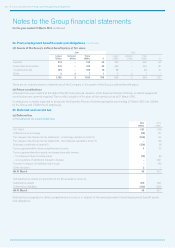
38. Retained earnings and other reserves continued
(iii) Movements in own shares held and own shares reserve
Number of own shares held Cost of own shares held
Trea sur y
million
Trusts
million
Total
million
Trea sur y
US$m
Trusts
US$m
Total
US$m
At 1 April 2013 20 22 42 234 331 565
Purchase of own shares held as treasury
shares 11 – 11 203 – 203
Purchase of own shares by employee trusts – 7 7 – 126 126
Exercise of share options and awards – (6) (6) – (85) (85)
Transfers 7 (7) – 119 (119) –
At 31 March 2014 38 16 54 556 253 809
Number of own shares held Cost of own shares held
Treasur y
million
Trusts
million
Total
million
Treasur y
US$m
Trusts
US$m
Total
US$m
At 1 April 2012 24 16 40 274 218 492
Purchase of own shares by employee trusts – 14 14 – 221 221
Exercise of share options and awards – (12) (12) – (148) (148)
Transfers (4) 4 – (40) 40 –
At 31 March 2013 20 22 42 234 331 565
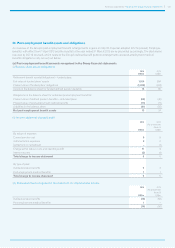
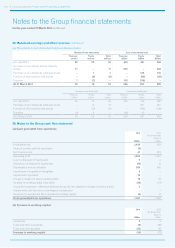
39. Notes to the Group cash flow statement
(a) Cash generated from operations
2014
US$m
2013
(Re-presented)
(Note 3)
US$m
Profit before tax 1,049 434
Share of post-tax profit of associates (2) –
Net finance costs 47 623
Operating profit 1,094 1,057
Loss on disposals of fixed assets 5 2
(Gain)/loss on disposal of businesses (14) 12
Depreciation and amortisation 500 465
Impairment of acquisition intangibles 9 –
Impairment of goodwill 15 –
Charge in respect of share incentive plans 70 78
Increase in working capital (note 39(b)) (36) (27)
Acquisition expenses – difference between Group income statement charge and amount paid 2 –
Adjustment to the fair value of contingent consideration – 1
Movement in exceptional items included in working capital (4) 14
Cash generated from operations 1,641 1,602
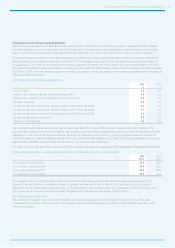
(b) Increase in working capital
2014
US$m
2013
(Re-presented)
(Note 3)
US$m
Inventories 3 3
Trade and other receivables (6) (68)
Trade and other payables (33) 38
Increase in working capital (36) (27)