Experian 2014 Annual Report Download - page 41
Download and view the complete annual report
Please find page 41 of the 2014 Experian annual report below. You can navigate through the pages in the report by either clicking on the pages listed below, or by using the keyword search tool below to find specific information within the annual report.-
 1
1 -
2
-
3
-
4
-
5
-
6
-
7
-
8
-
9
-
10
-
11
-
12
-
13
-
14
-
15
-
16
-
17
-
18
-
19
-
20
-
21
-
22
-
23
-
24
-
25
-
26
-
27
-
28
-
29
-
30
-
 31
31 -
 32
32 -
 33
33 -
 34
34 -
 35
35 -
 36
36 -
 37
37 -
 38
38 -
 39
39 -
 40
40 -
 41
41 -
 42
42 -
 43
43 -
 44
44 -
 45
45 -
 46
46 -
 47
47 -
 48
48 -
 49
49 -
 50
50 -
 51
51 -
52
-
53
-
54
-
55
-
56
-
57
-
58
-
59
-
60
-
61
-
62
-
63
-
64
-
65
-
66
-
67
-
68
-
69
-
70
-
71
-
72
-
73
-
74
-
75
-
76
-
77
-
78
-
79
-
80
-
81
-
82
-
83
-
84
-
85
-
86
-
87
-
88
-
89
-
90
-
91
-
92
-
93
-
94
-
95
-
96
-
97
-
98
-
99
-
100
-
101
-
102
-
103
-
104
-
105
-
106
-
107
-
108
-
109
-
110
-
111
-
112
-
113
-
114
-
115
-
116
-
117
-
118
-
119
-
120
-
121
-
122
-
123
-
124
-
125
-
126
-
127
-
128
-
129
-
130
-
131
-
132
-
133
-
134
-
135
-
136
-
137
-
138
-
139
-
140
-
141
-
142
-
143
-
144
-
145
-
146
-
147
-
148
-
149
-
150
-
151
-
152
-
153
-
154
-
155
-
156
-
157
-
158
-
159
-
160
-
161
-
162
-
163
-
164
-
165
-
166
-
167
-
168
-
169
-
170
-
171
-
172
-
173
-
174
-
175
-
176
-
177
-
178
 |
 |
Strategic report • Latin America
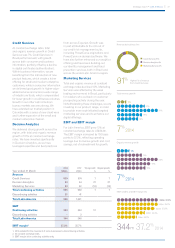
Credit Services
At constant exchange rates, total
and organic revenue growth in Credit
Services was 7%. Credit Services in
Brazil performed well, with growth
across both consumer and business
information, partially offset by a decline
in digital certificates (authentication).
Within business information, we are
benefiting from the introduction of new
product features, which create a richer
offering for small and medium enterprise
customers, while in consumer information
we delivered good growth in higher value-
added services and across a wide range
of industry verticals, which compensated
for lower growth in credit bureau volumes.
Growth in our other Latin American
bureau markets was very strong. We
have extended our market position in
Colombia with a series of new client wins
and further expansion of the small and
medium enterprise channel.
Decision Analytics
We delivered strong growth across the
region, with total and organic revenue
growth of 37% at constant exchange
rates. We have invested significantly
in Decision Analytics, as we have
leveraged expertise and best practices
from across Experian. Growth was
in part attributable to the roll-out of
our credit risk management suite,
including PowerCurve originations and
PowerCurve on-demand software. We
have also further enhanced our analytics
offering and have been building-out
our identity management and fraud
prevention services, both in Brazil and
across the wider Latin America region.
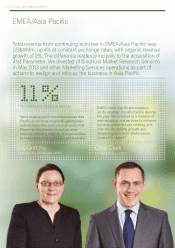
Marketing Services
Total and organic revenue at constant
exchange rates declined 10%. Marketing
Services was affected by the weak
trading environment in Brazil, particularly
for retailers who cut back on customer
prospecting activity during the year.
Notwithstanding these challenges, we are
investing in our product range, in order
to provide more sophisticated targeted
marketing services and to enhance our
digital offerings.
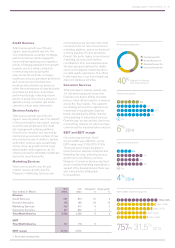
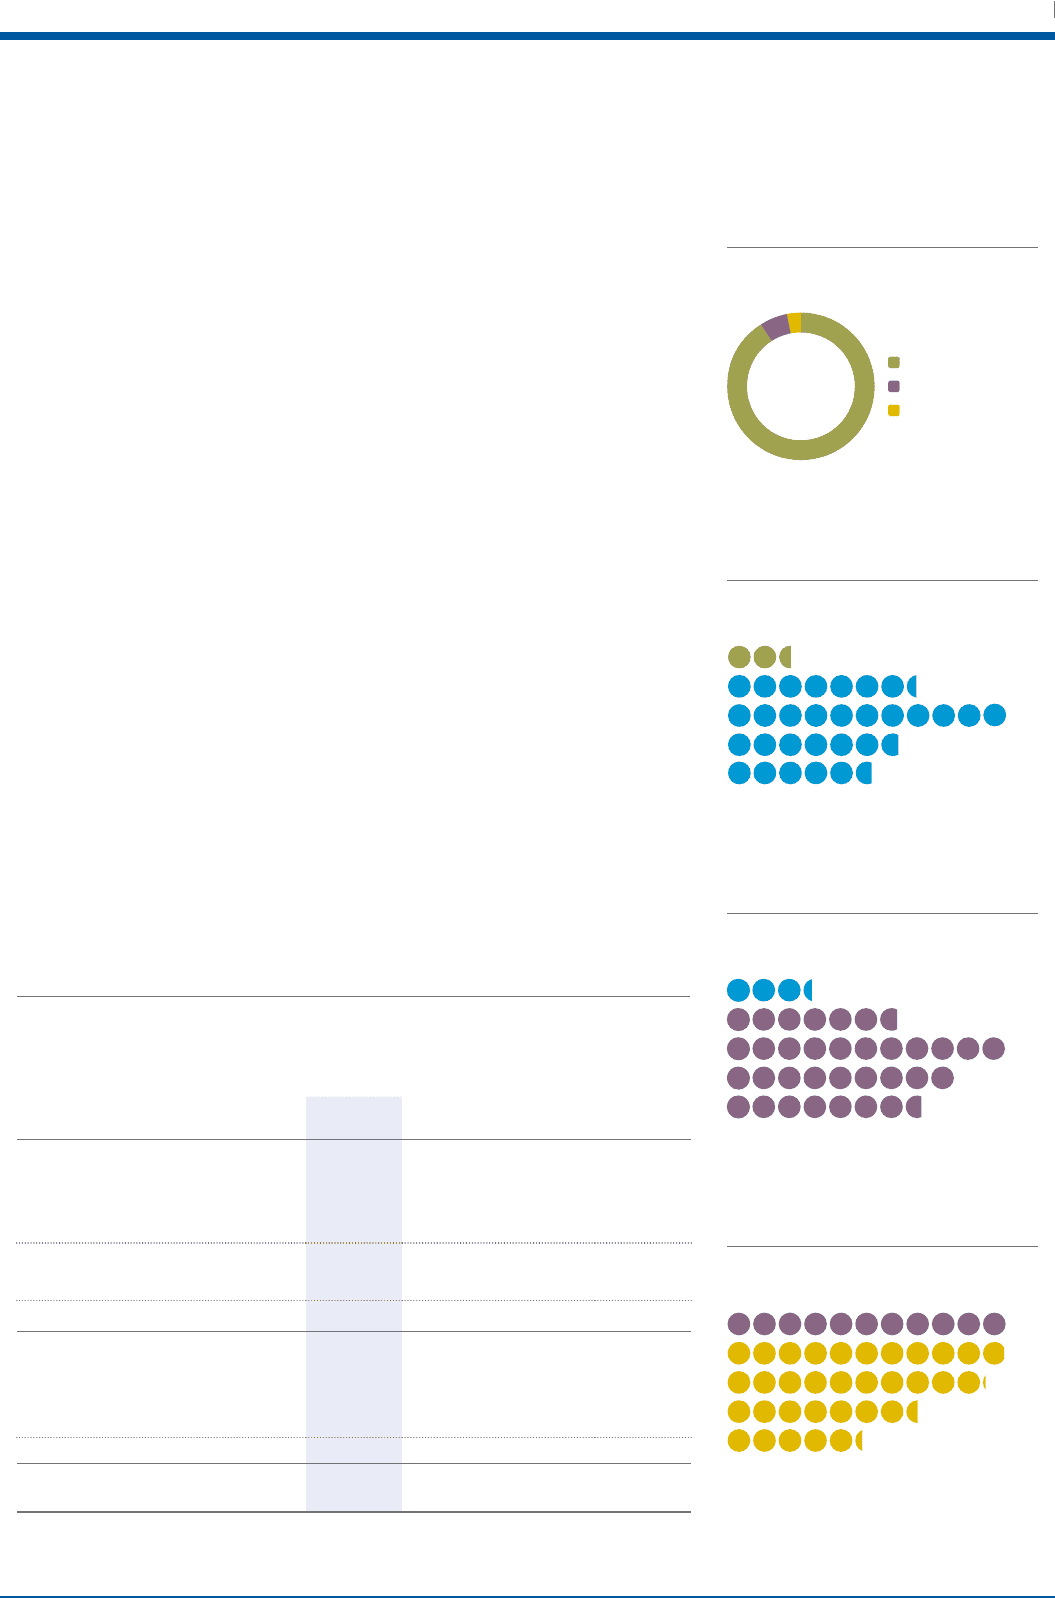
EBIT and EBIT margin
For Latin America, EBIT grew 12% at
constant exchange rates to US$344m.
The EBIT margin increased by 150 basis
points to 37.2%, reflecting operating
leverage due to revenue growth and cost
savings, net of reinvestment for growth.
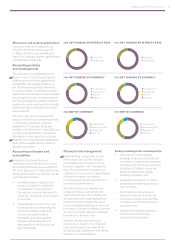
Credit Services 91%
Decision Analytics 6%
Marketing Services 3%
91%Highest % of revenue
from Credit Services
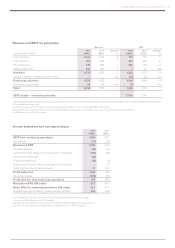
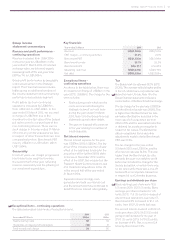
Year ended 31 March
2014
US$m
20131
US$m
Total grow th2
%
Organic growth
2
%
Revenue
Credit Services 839 874 7 7
Decision Analytics 53 44 37 37
Marketing Services 33 42 (10) (10)
Total continuing activities 925 960 7 7
Discontinuing activities 21 41
Total Latin America 946 1,001
EBIT
Continuing activities 344 343 12
Discontinuing activities –3
Total Latin America 344 346
EBIT margin337.2% 35.7%
1. 2013 restated for the movement of some businesses to discontinuing activities.
2. At constant exchange rates.
3. EBIT margin is for continuing activities only.
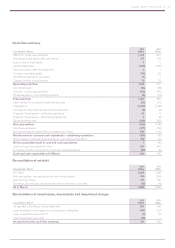
344m 37.2% 2014
7% 2014
7% 2014
31%
16%
21%
19%
7%
10
12
11
13
14
16%
19%
23%
14%
7%
10
12
11
13
14
343m 35.7%
33.3%
32.5%
29.7%
320m
166m
235m
344m 37.2%
10
12
11
13
14
37
EBIT (US$m) and EBIT margin (%)
Revenue by business line
Total revenue growth
Organic revenue growth