Experian 2014 Annual Report Download - page 113
Download and view the complete annual report
Please find page 113 of the 2014 Experian annual report below. You can navigate through the pages in the report by either clicking on the pages listed below, or by using the keyword search tool below to find specific information within the annual report.-
 1
1 -
2
-
3
-
4
-
5
-
6
-
7
-
8
-
9
-
10
-
11
-
12
-
13
-
14
-
15
-
16
-
17
-
18
-
19
-
20
-
21
-
22
-
23
-
24
-
25
-
26
-
27
-
28
-
29
-
30
-
31
-
32
-
33
-
34
-
35
-
36
-
37
-
38
-
39
-
40
-
41
-
42
-
43
-
44
-
45
-
46
-
47
-
48
-
49
-
50
-
51
-
52
-
53
-
54
-
55
-
56
-
57
-
58
-
59
-
60
-
61
-
62
-
63
-
64
-
65
-
66
-
67
-
68
-
69
-
70
-
71
-
72
-
73
-
74
-
75
-
76
-
77
-
78
-
79
-
80
-
81
-
82
-
83
-
84
-
85
-
86
-
87
-
88
-
89
-
90
-
91
-
92
-
93
-
94
-
95
-
96
-
97
-
98
-
99
-
100
-
101
-
102
-
 103
103 -
 104
104 -
 105
105 -
 106
106 -
 107
107 -
 108
108 -
 109
109 -
 110
110 -
 111
111 -
 112
112 -
 113
113 -
 114
114 -
 115
115 -
 116
116 -
 117
117 -
 118
118 -
 119
119 -
 120
120 -
 121
121 -
 122
122 -
 123
123 -
124
-
125
-
126
-
127
-
128
-
129
-
130
-
131
-
132
-
133
-
134
-
135
-
136
-
137
-
138
-
139
-
140
-
141
-
142
-
143
-
144
-
145
-
146
-
147
-
148
-
149
-
150
-
151
-
152
-
153
-
154
-
155
-
156
-
157
-
158
-
159
-
160
-
161
-
162
-
163
-
164
-
165
-
166
-
167
-
168
-
169
-
170
-
171
-
172
-
173
-
174
-
175
-
176
-
177
-
178
 |
 |

109
Financial statements • Group cash flow statement
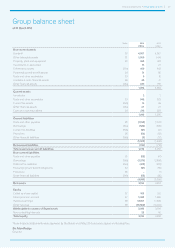
Group cash flow statement
for the year ended 31 March 2014
Notes 2014
US$m
2013
US$m
Cash flows from operating activities
Cash generated from operations 39(a) 1,641 1,602
Interest paid (95) (80)
Interest received 21 12
Dividends received from associates 1 1
Tax paid 39(d) (174) (162)
Net cash inflow from operating activities – continuing operations 1,394 1,373
Net cash inflow from operating activities – discontinued operations 17(b) 140 64
Net cash inflow from operating activities 1,534 1,437
Cash flows from investing activities
Purchase of other intangible assets (319) (345)
Purchase of property, plant and equipment (83) (115)
Sale of property, plant and equipment 8 1
Purchase of investments in associates – (8)
Purchase of other financial assets (3) –
Acquisition of subsidiaries, net of cash acquired 39(e) (1,223) (38)
Disposal of subsidiaries – continuing operations 25 5
Disposal of subsidiaries – discontinued operations 42(b) 5 (8)
Net cash flows used in investing activities (1,590) (508)
Cash flows from financing activities
Employee share incentive plans:
– proceeds from issue of ordinary shares 39(f) 13 9
– net cash (outflow)/inflow on vesting of share awards and exercise of share options 39(f) (55) 61
– purchase of own shares by employee trusts 39(f) (126) (250)
– other payments (7) (4)
Purchase of own shares held as treasury shares 39(f) (203) –
Payments to acquire non-controlling interests 39(g) (19) (1,507)
New borrowings 1,911 1,135
Repayment of borrowings (1,139) (12)
Capital element of finance lease rental payments (5) (1)
Net receipts on derivative financial instruments held to manage currency profile 43 –
Net receipts from equity swaps 5 –
Dividends paid (355) (376)
Net cash flows from/(used in) financing activities 63 (945)
Net increase/(decrease) in cash and cash equivalents 7 (16)
Cash and cash equivalents at 1 April 226 254
Exchange and other movements on cash and cash equivalents (25) (12)
Cash and cash equivalents at 31 March 39(h) 208 226