Experian 2014 Annual Report Download - page 33
Download and view the complete annual report
Please find page 33 of the 2014 Experian annual report below. You can navigate through the pages in the report by either clicking on the pages listed below, or by using the keyword search tool below to find specific information within the annual report.-
 1
1 -
2
-
3
-
4
-
5
-
6
-
7
-
8
-
9
-
10
-
11
-
12
-
13
-
14
-
15
-
16
-
17
-
18
-
19
-
20
-
21
-
22
-
 23
23 -
 24
24 -
 25
25 -
 26
26 -
 27
27 -
 28
28 -
 29
29 -
 30
30 -
 31
31 -
 32
32 -
 33
33 -
 34
34 -
 35
35 -
 36
36 -
 37
37 -
 38
38 -
 39
39 -
 40
40 -
 41
41 -
 42
42 -
 43
43 -
44
-
45
-
46
-
47
-
48
-
49
-
50
-
51
-
52
-
53
-
54
-
55
-
56
-
57
-
58
-
59
-
60
-
61
-
62
-
63
-
64
-
65
-
66
-
67
-
68
-
69
-
70
-
71
-
72
-
73
-
74
-
75
-
76
-
77
-
78
-
79
-
80
-
81
-
82
-
83
-
84
-
85
-
86
-
87
-
88
-
89
-
90
-
91
-
92
-
93
-
94
-
95
-
96
-
97
-
98
-
99
-
100
-
101
-
102
-
103
-
104
-
105
-
106
-
107
-
108
-
109
-
110
-
111
-
112
-
113
-
114
-
115
-
116
-
117
-
118
-
119
-
120
-
121
-
122
-
123
-
124
-
125
-
126
-
127
-
128
-
129
-
130
-
131
-
132
-
133
-
134
-
135
-
136
-
137
-
138
-
139
-
140
-
141
-
142
-
143
-
144
-
145
-
146
-
147
-
148
-
149
-
150
-
151
-
152
-
153
-
154
-
155
-
156
-
157
-
158
-
159
-
160
-
161
-
162
-
163
-
164
-
165
-
166
-
167
-
168
-
169
-
170
-
171
-
172
-
173
-
174
-
175
-
176
-
177
-
178
 |
 |

29
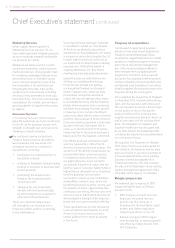
Strategic report • Chief Executive’s statement
Total revenue growth from continuing
activities was 7% at constant currency
and organic revenue growth was
5% (H1 6%, H2 5%). We saw further
progress in EBIT margins, which rose
by 30 basis points to 27.4%, with EBIT
rising 8% at constant currencies.
Actual revenue and EBIT growth were
4% and 5% respectively, including the
contribution from recent acquisitions,
offset by negative currency translation
effects. Benchmark EPS increased to
91.7 US cents per share, up 8% at actual
exchange rates.
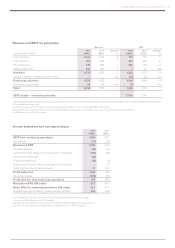
Notable highlights include:
• We grew across all four regions, with
organic revenue growth of 7% in Latin
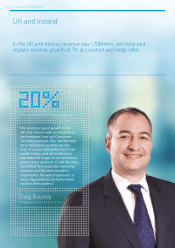
America, 7% in the UK and Ireland,
4% in North America and 2% in
EMEA/Asia Pacific.
• We also grew across all four
global business lines, with organic
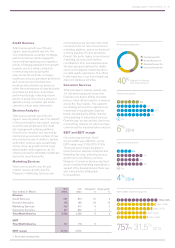
revenue growth of 10% in Decision
Analytics, 5% in Credit Services, 5%
in Consumer Services and 1% in
Marketing Services.
• Cash generation was a particular
highlight, as we converted 101% of
EBIT into operating cash, resulting
in a net debt to EBITDA ratio of 2.27
times, from a peak of over 2.5 times
in November 2013.
• We made significant strategic
progress, as we concentrate our
efforts across key growth initiatives.
We are placing significant emphasis
on fraud and identity management,
we are becoming increasingly
focused on a select number of
industry verticals and we are
sharpening our operations in our
most exciting geographies.
• We also raised our full year dividend
by 8% to 37.50 US cents per share.
Strategic and operational review
Let me focus on specific highlights for the
year and comment on our future direction:
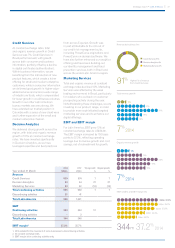
Credit Services
We delivered good revenue growth in
Credit Services, up 5% organically.
With confidence gradually returning to
the retail lending sector, the core bureau
in North America performed well. While
declines in the US mortgage market
held back growth somewhat, lenders
are generally prospecting more for new
credit customers. We are also benefiting
as we steadily reduce our dependency on
financial services and raise our exposure
to faster-growing market segments.
We took a significant step in this
regard with the acquisition of Passport
Health Communications (‘Passport’)
which, combined with our existing
operations, makes us the leader in US
healthcare revenue cycle management,
a highly attractive market. Passport has
performed well since acquisition, as
described in more detail below.
Macro-economically, it was a challenging
year in Latin America, particularly in
Brazil. That said, it is gratifying to note
that our bureaux in the region were
collectively the fastest growing in the
Experian portfolio. During the year we
strengthened our operations in Brazil,
stepping up our ability to grow through
new products, new clients, new verticals
and by deploying services which straddle
our whole business. And while the World
Cup poses specific challenges in H1, we
are well placed to continue to expand
in Brazil and across the region over the
medium term.
We have seen improving momentum in
the UK, where we have placed significant
emphasis on increasing the data depth
of the bureau. This helps to open up new
market opportunities, enables greater
levels of innovation and ultimately creates
ever greater competitive distinction for
Experian. Overall, we feel well placed
as confidence and investment return to
the UK economy. Meanwhile, in EMEA/
Asia Pacific, we have acted to strengthen
our operations in parts of Continental
Europe, with good results, and we are
fully engaged in building positive data
in Australia, following the enactment of
regulations in March.
Decision Analytics
I am delighted with progress in Decision
Analytics, which returned to strong
revenue growth, up 10% organically.
For some time now, we have been
investing in our products and flexing our
infrastructure with the aim of creating a
more sustainable, high-growth Decision
Analytics business. We have made
considerable advances, positioning us
well for the future. PowerCurve, our new
flagship credit risk management software,
has met with worldwide success, and we
will continue the roll-out over the coming
year. Fraud and identity management
increasingly represents a new dimension
to our business, and has been pivotal in
opening up a new set of opportunities
in new client segments such as the US
public sector. We are investing further in
analytics, meeting demand from clients
for sophisticated tools to help them deal
with their big data challenges. Finally, I
should note the particular success we
have met with in EMEA/Asia Pacific
which, in response to previous actions,
recovered during the year.
P34
P38
P40
P34
P40
P36