Experian 2014 Annual Report Download - page 147
Download and view the complete annual report
Please find page 147 of the 2014 Experian annual report below. You can navigate through the pages in the report by either clicking on the pages listed below, or by using the keyword search tool below to find specific information within the annual report.-
 1
1 -
2
-
3
-
4
-
5
-
6
-
7
-
8
-
9
-
10
-
11
-
12
-
13
-
14
-
15
-
16
-
17
-
18
-
19
-
20
-
21
-
22
-
23
-
24
-
25
-
26
-
27
-
28
-
29
-
30
-
31
-
32
-
33
-
34
-
35
-
36
-
37
-
38
-
39
-
40
-
41
-
42
-
43
-
44
-
45
-
46
-
47
-
48
-
49
-
50
-
51
-
52
-
53
-
54
-
55
-
56
-
57
-
58
-
59
-
60
-
61
-
62
-
63
-
64
-
65
-
66
-
67
-
68
-
69
-
70
-
71
-
72
-
73
-
74
-
75
-
76
-
77
-
78
-
79
-
80
-
81
-
82
-
83
-
84
-
85
-
86
-
87
-
88
-
89
-
90
-
91
-
92
-
93
-
94
-
95
-
96
-
97
-
98
-
99
-
100
-
101
-
102
-
103
-
104
-
105
-
106
-
107
-
108
-
109
-
110
-
111
-
112
-
113
-
114
-
115
-
116
-
117
-
118
-
119
-
120
-
121
-
122
-
123
-
124
-
125
-
126
-
127
-
128
-
129
-
130
-
131
-
132
-
133
-
134
-
135
-
136
-
 137
137 -
 138
138 -
 139
139 -
 140
140 -
 141
141 -
 142
142 -
 143
143 -
 144
144 -
 145
145 -
 146
146 -
 147
147 -
 148
148 -
 149
149 -
 150
150 -
 151
151 -
 152
152 -
 153
153 -
 154
154 -
 155
155 -
 156
156 -
 157
157 -
158
-
159
-
160
-
161
-
162
-
163
-
164
-
165
-
166
-
167
-
168
-
169
-
170
-
171
-
172
-
173
-
174
-
175
-
176
-
177
-
178
 |
 |

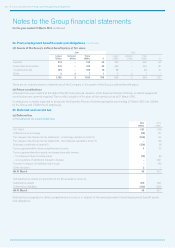
Financial statements • Notes to the Group financial statements 143
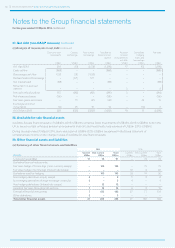
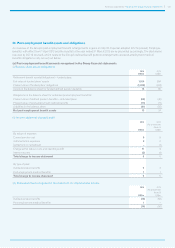
Liabilities
2014 2013
Current
US$m
Non-current
US$m
Total
US$m
Current
US$m
Non-current
US$m
Total
US$m
Derivative financial instruments:
Fair value hedge of borrowings (interest rate swaps) – 1 1 – – –
Derivatives used for hedging – 1 1 – – –
Non-hedging derivatives (equity swaps) – 1 1 – – –
Non-hedging derivatives (foreign exchange contracts) 2 – 2 3 – 3
Non-hedging derivatives (interest rate swaps) 3 19 22 2 40 42
Liabilities at fair value through profit and loss 5 20 25 5 40 45
Derivative financial instruments 5 21 26 5 40 45
Options in respect of non-controlling interests – 44 44 15 40 55
Total other financial liabilities 5 65 70 20 80 100
Amounts recognised in the Group income statement in connection with the Group’s hedging instruments are disclosed in note 15.
There is no material difference between the fair values and the book values stated above. Loans and receivables principally comprise
amounts due following the disposal of businesses.
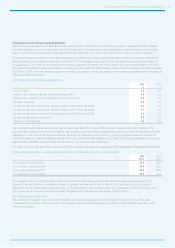
(b) Fair value and notional principal amounts of derivative financial instruments
2014 2013
Assets Liabilities Assets Liabilities
Fair value
US$m
Notional
US$m
Fair value
US$m
Notional
US$m
Fair value
US$m
Notional
US$m
Fair value
US$m
Notional
US$m
Cross currency swaps 143 1,347 – – 70 1,347 – –
Interest rate swaps 12 1,366 23 2,570 22 858 42 2,087
Equity swaps 2 8 1 10 8 17 – –
Foreign exchange contracts 5 410 2 286 4 203 3 171
162 3,131 26 2,866 104 2,425 45 2,258
(c) Offsetting derivative financial assets and financial liabilities
Assets Liabilities
2014
US$m
2013
US$m
2014
US$m
2013
US$m
Amounts reported in the Group balance sheet 165 104 26 45
Related amounts not offset in the Group balance sheet (21) (39) (21) (39)
Net amount 144 65 5 6
There are no amounts offset within the values reported for assets and liabilities in the Group balance sheet.