Experian 2014 Annual Report Download - page 125
Download and view the complete annual report
Please find page 125 of the 2014 Experian annual report below. You can navigate through the pages in the report by either clicking on the pages listed below, or by using the keyword search tool below to find specific information within the annual report.-
 1
1 -
2
-
3
-
4
-
5
-
6
-
7
-
8
-
9
-
10
-
11
-
12
-
13
-
14
-
15
-
16
-
17
-
18
-
19
-
20
-
21
-
22
-
23
-
24
-
25
-
26
-
27
-
28
-
29
-
30
-
31
-
32
-
33
-
34
-
35
-
36
-
37
-
38
-
39
-
40
-
41
-
42
-
43
-
44
-
45
-
46
-
47
-
48
-
49
-
50
-
51
-
52
-
53
-
54
-
55
-
56
-
57
-
58
-
59
-
60
-
61
-
62
-
63
-
64
-
65
-
66
-
67
-
68
-
69
-
70
-
71
-
72
-
73
-
74
-
75
-
76
-
77
-
78
-
79
-
80
-
81
-
82
-
83
-
84
-
85
-
86
-
87
-
88
-
89
-
90
-
91
-
92
-
93
-
94
-
95
-
96
-
97
-
98
-
99
-
100
-
101
-
102
-
103
-
104
-
105
-
106
-
107
-
108
-
109
-
110
-
111
-
112
-
113
-
114
-
 115
115 -
 116
116 -
 117
117 -
 118
118 -
 119
119 -
 120
120 -
 121
121 -
 122
122 -
 123
123 -
 124
124 -
 125
125 -
 126
126 -
 127
127 -
 128
128 -
 129
129 -
 130
130 -
 131
131 -
 132
132 -
 133
133 -
 134
134 -
 135
135 -
136
-
137
-
138
-
139
-
140
-
141
-
142
-
143
-
144
-
145
-
146
-
147
-
148
-
149
-
150
-
151
-
152
-
153
-
154
-
155
-
156
-
157
-
158
-
159
-
160
-
161
-
162
-
163
-
164
-
165
-
166
-
167
-
168
-
169
-
170
-
171
-
172
-
173
-
174
-
175
-
176
-
177
-
178
 |
 |

Financial statements • Notes to the Group financial statements 121
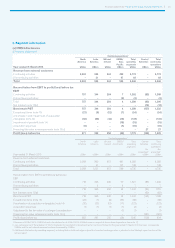
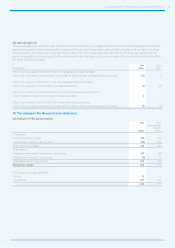
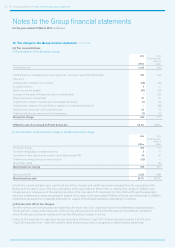
9. Segment information
(a) IFRS 8 disclosures
(i) Income statement
Year ended 31 March 2014
Continuing operations1
North
America
US$m
Latin
America
US$m
UK and
Ireland
US$m
EMEA/
Asia
Pacific
US$m
Total
operating
segments
US$m
Central
Activities
US$m
Total
continuing
operations
US$m
Revenue from external customers
Continuing activities 2,404 925 944 499 4,772 – 4,772
Discontinuing activities – 21 – 47 68 – 68
Tot al 2,404 946 944 546 4,840 – 4,840
Reconciliation from EBIT to profit/(loss) before tax
EBIT
Continuing activities 757 344 284 7 1,392 (83) 1,309
Discontinuing activities – – – (3) (3) – (3)
Total 757 344 284 4 1,389 (83) 1,306
Net interest (note 15(b)) – – – – – (74) (74)
Benchmark PBT 757 344 284 4 1,389 (157) 1,232
Exceptional items (note 13) (27) (8) (12) (7) (54) – (54)
Amortisation and impairment of acquisition
intangibles (note 14) (50) (48) (14) (19) (131) – (131)
Impairment of goodwill (note 14) – – – (15) (15) –(15)
Acquisition expenses (9) – – (1) (10) – (10)
Financing fair value remeasurements (note 15(c)) – – – – – 27 27
Profit/(loss) before tax 671 288 258 (38) 1,179 (130) 1,049
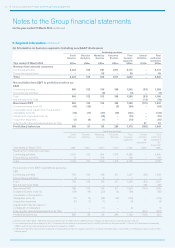
Year ended 31 March 2013
Continuing operations1
North
America
US$m
Latin
America
US$m
UK and
Ireland
US$m
EMEA/
Asia Pacific
US$m
Total
operating
segments
US$m
Central
Activities
Re-
presented2
US$m
Total
continuing
operations
Re-
presented2
US$m
Revenue from external customers
Continuing activities 2,258 960 873 491 4,582 – 4,582
Discontinuing activities – 41 – 107 148 – 148
Total 2,258 1,001 873 598 4,730 – 4,730
Reconciliation from EBIT to profit/(loss) before tax
EBIT
Continuing activities 718 343 246 20 1,327 (83) 1,244
Discontinuing activities – 3 – 4 7 – 7
Total 718 346 246 24 1,334 (83) 1,251
Net interest (note 15(b)) – – – – – (62) (62)
Benchmark PBT 718 346 246 24 1,334 (145) 1,18 9
Exceptional items (note 13) (23) (1) (9) (33) (66) – (66)
Amortisation of acquisition intangibles (note 14) (32) (53) (21) (17) (123) – (123)
Acquisition expenses (1) (1) (1) (1) (4) – (4)
Adjustment to the fair value of contingent consideration – – – (1) (1) – (1)
Financing fair value remeasurements (note 15(c)) – – – – – (561) (561)
Profit/(loss) before tax 662 291 215 (28) 1,140 (706) 434
1. Revenue of US$nil (2013: US$147m) and a loss before tax of US$nil (2013: US$5m) arose in respect of discontinued operations (see note 17).
2. As a consequence of the adoption of IAS 19 (revised), the loss before interest and tax for Central Activities for the year ended 31 March 2013 has been increased by
US$2m and the net interest expense has been increased by US$4m.
3. Additional information by operating segment, including that on total and organic growth at constant exchange rates, is provided in the Strategic report section of the
annual report.