Experian 2014 Annual Report Download - page 146
Download and view the complete annual report
Please find page 146 of the 2014 Experian annual report below. You can navigate through the pages in the report by either clicking on the pages listed below, or by using the keyword search tool below to find specific information within the annual report.-
 1
1 -
2
-
3
-
4
-
5
-
6
-
7
-
8
-
9
-
10
-
11
-
12
-
13
-
14
-
15
-
16
-
17
-
18
-
19
-
20
-
21
-
22
-
23
-
24
-
25
-
26
-
27
-
28
-
29
-
30
-
31
-
32
-
33
-
34
-
35
-
36
-
37
-
38
-
39
-
40
-
41
-
42
-
43
-
44
-
45
-
46
-
47
-
48
-
49
-
50
-
51
-
52
-
53
-
54
-
55
-
56
-
57
-
58
-
59
-
60
-
61
-
62
-
63
-
64
-
65
-
66
-
67
-
68
-
69
-
70
-
71
-
72
-
73
-
74
-
75
-
76
-
77
-
78
-
79
-
80
-
81
-
82
-
83
-
84
-
85
-
86
-
87
-
88
-
89
-
90
-
91
-
92
-
93
-
94
-
95
-
96
-
97
-
98
-
99
-
100
-
101
-
102
-
103
-
104
-
105
-
106
-
107
-
108
-
109
-
110
-
111
-
112
-
113
-
114
-
115
-
116
-
117
-
118
-
119
-
120
-
121
-
122
-
123
-
124
-
125
-
126
-
127
-
128
-
129
-
130
-
131
-
132
-
133
-
134
-
135
-
 136
136 -
 137
137 -
 138
138 -
 139
139 -
 140
140 -
 141
141 -
 142
142 -
 143
143 -
 144
144 -
 145
145 -
 146
146 -
 147
147 -
 148
148 -
 149
149 -
 150
150 -
 151
151 -
 152
152 -
 153
153 -
 154
154 -
 155
155 -
 156
156 -
157
-
158
-
159
-
160
-
161
-
162
-
163
-
164
-
165
-
166
-
167
-
168
-
169
-
170
-
171
-
172
-
173
-
174
-
175
-
176
-
177
-
178
 |
 |

Financial statements • Notes to the Group financial statements
Notes to the Group financial statements
for the year ended 31 March 2014 continued
142
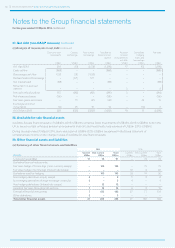
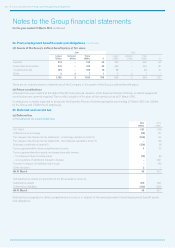
27. Net debt (non-GAAP measure) continued
(c) Analysis of movements in net debt continued
Cash and cash
equivalents
US$m
Current
borrowings
US$m
Non-current
borrowings
US$m
Net debt by
balance sheet
caption
US$m
Accrued
interest
excluded from
net debt
US$m
Derivatives
hedging
loans and
borrowings
US$m
Net debt
US$m
At 1 April 2012 254 (13) (2,179) (1,938) 17 103 (1,818)
Cash outflow (888) – – (888) – – (888)
Borrowings cash flow 1,123 (91) (1,032) – – – –
Reclassification of borrowings – (571) 571 – – – –
Net interest paid (68) – – (68) – – (68)
Movement on accrued
interest – – – – 2 – 2
Net cash inflow/(outflow) 167 (662) (461) (956) 2 – (954)
Net share purchases (180) – – (180) – – (180)
Fair value gains and losses – 15 (47) (32) – 44 12
Exchange and other
movements (12) 25 61 74 – (72) 2
At 31 March 2013 229 (635) (2,626) (3,032) 19 75 (2,938)
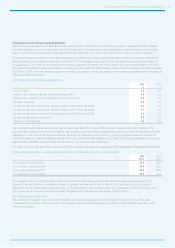
28. Available-for-sale financial assets
Available-for-sale financial assets of US$46m (2013: US$41m) comprise listed investments of US$43m (2013: US$38m) held in the
UK to secure certain unfunded pension arrangements (note 34) and investments held overseas of US$3m (2013: US$3m).
During the year ended 31 March 2014, there was a gain of US$5m (2013: US$3m) recognised in the Group statement of
comprehensive income on the change in value of available-for-sale financial assets.
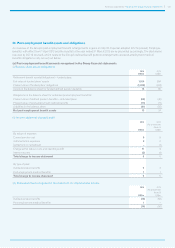
29. Other financial assets and liabilities
(a) Summary of other financial assets and liabilities
Assets
2014 2013
Current
US$m
Non-current
US$m
Total
US$m
Current
US$m
Non-current
US$m
Total
US$m
Loans and receivables 17 74 91 – 79 79
Derivative financial instruments:
Fair value hedge of borrowings (cross currency swaps) – 143 143 – 70 70
Fair value hedge of borrowings (interest rate swaps) – – – 18 4 22
Derivatives used for hedging – 143 143 18 74 92
Non-hedging derivatives (equity swaps) 2 – 2 5 3 8
Non-hedging derivatives (foreign exchange contracts) 5 – 5 4 – 4
Non-hedging derivatives (interest rate swaps) – 12 12 – – –
Assets at fair value through profit and loss 7 12 19 9 3 12
Derivative financial instruments 7 155 162 27 77 104
Other derivatives 3 – 3 – – –
Total other financial assets 27 229 256 27 156 183