Wells Fargo 2007 Annual Report Download - page 99
Download and view the complete annual report
Please find page 99 of the 2007 Wells Fargo annual report below. You can navigate through the pages in the report by either clicking on the pages listed below, or by using the keyword search tool below to find specific information within the annual report.-
 1
1 -
2
-
3
-
4
-
5
-
6
-
7
-
8
-
9
-
10
-
11
-
12
-
13
-
14
-
15
-
16
-
17
-
18
-
19
-
20
-
21
-
22
-
23
-
24
-
25
-
26
-
27
-
28
-
29
-
30
-
31
-
32
-
33
-
34
-
35
-
36
-
37
-
38
-
39
-
40
-
41
-
42
-
43
-
44
-
45
-
46
-
47
-
48
-
49
-
50
-
51
-
52
-
53
-
54
-
55
-
56
-
57
-
58
-
59
-
60
-
61
-
62
-
63
-
64
-
65
-
66
-
67
-
68
-
69
-
70
-
71
-
72
-
73
-
74
-
75
-
76
-
77
-
78
-
79
-
80
-
81
-
82
-
83
-
84
-
85
-
86
-
87
-
88
-
 89
89 -
 90
90 -
 91
91 -
 92
92 -
 93
93 -
 94
94 -
 95
95 -
 96
96 -
 97
97 -
 98
98 -
 99
99 -
 100
100 -
 101
101 -
 102
102 -
 103
103 -
 104
104 -
 105
105 -
 106
106 -
 107
107 -
 108
108 -
 109
109 -
110
-
111
-
112
-
113
-
114
-
115
-
116
-
117
-
118
-
119
-
120
-
121
-
122
-
123
-
124
-
125
-
126
-
127
-
128
-
129
-
130
-
131
-
132
-
133
-
134
-
135
-
136
 |
 |

96
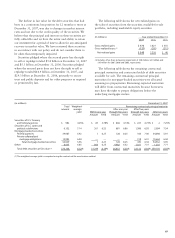
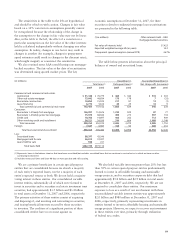
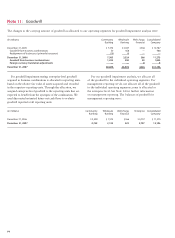
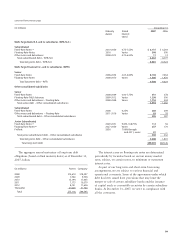
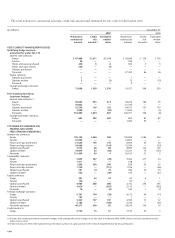
The changes in the carrying amount of goodwill as allocated to our operating segments for goodwill impairment analysis were:
Note 11: Goodwill
For goodwill impairment testing, enterprise-level goodwill
acquired in business combinations is allocated to reporting units
based on the relative fair value of assets acquired and recorded
in the respective reporting units. Through this allocation, we
assigned enterprise-level goodwill to the reporting units that are
expected to benefit from the synergies of the combination. We
used discounted estimated future net cash flows to evaluate
goodwill reported at all reporting units.
For our goodwill impairment analysis, we allocate all
of the goodwill to the individual operating segments. For
management reporting we do not allocate all of the goodwill
to the individual operating segments; some is allocated at
the enterprise level. See Note 24 for further information
on management reporting. The balances of goodwill for
management reporting were:
(in millions) Community Wholesale Wells Fargo Enterprise Consolidated
Banking Banking Financial Company
December 31, 2006 $ 3,538 $ 1,574 $366 $ 5,797 $ 11,275
December 31, 2007 4,762 2,124 423 5,797 13,106
(in millions) Community Wholesale Wells Fargo Consolidated
Banking Banking Financial Company
December 31, 2005 $ 7,374 $ 3,047 $366 $ 10,787
Goodwill from business combinations 30 458 — 488
Realignment of businesses (primarily insurance) (19) 19 — —
December 31, 2006 7,385 3,524 366 11,275
Goodwill from business combinations 1,224 550 49 1,823
Foreign currency translation adjustments — — 8 8
December 31, 2007 $8,609 $4,074 $423 $13,106