Wells Fargo 2007 Annual Report Download - page 63
Download and view the complete annual report
Please find page 63 of the 2007 Wells Fargo annual report below. You can navigate through the pages in the report by either clicking on the pages listed below, or by using the keyword search tool below to find specific information within the annual report.-
 1
1 -
2
-
3
-
4
-
5
-
6
-
7
-
8
-
9
-
10
-
11
-
12
-
13
-
14
-
15
-
16
-
17
-
18
-
19
-
20
-
21
-
22
-
23
-
24
-
25
-
26
-
27
-
28
-
29
-
30
-
31
-
32
-
33
-
34
-
35
-
36
-
37
-
38
-
39
-
40
-
41
-
42
-
43
-
44
-
45
-
46
-
47
-
48
-
49
-
50
-
51
-
52
-
 53
53 -
 54
54 -
 55
55 -
 56
56 -
 57
57 -
 58
58 -
 59
59 -
 60
60 -
 61
61 -
 62
62 -
 63
63 -
 64
64 -
 65
65 -
 66
66 -
 67
67 -
 68
68 -
 69
69 -
 70
70 -
 71
71 -
 72
72 -
 73
73 -
74
-
75
-
76
-
77
-
78
-
79
-
80
-
81
-
82
-
83
-
84
-
85
-
86
-
87
-
88
-
89
-
90
-
91
-
92
-
93
-
94
-
95
-
96
-
97
-
98
-
99
-
100
-
101
-
102
-
103
-
104
-
105
-
106
-
107
-
108
-
109
-
110
-
111
-
112
-
113
-
114
-
115
-
116
-
117
-
118
-
119
-
120
-
121
-
122
-
123
-
124
-
125
-
126
-
127
-
128
-
129
-
130
-
131
-
132
-
133
-
134
-
135
-
136
 |
 |

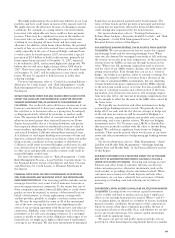
60
We consider the allowance for credit losses of $5.52 billion
adequate to cover credit losses inherent in the loan portfolio,
including unfunded credit commitments, at December 31, 2007.
Given that the majority of our loan portfolio is consumer
loans, for which losses tend to emerge within a relatively
short, predictable timeframe, and that a significant portion
of the allowance for credit losses is related to estimated
credit losses associated with consumer loans, management
believes that the provision for credit losses for consumer
loans, absent any significant credit event, severe decrease in
collateral values, significant acceleration of losses or signifi-
cant change in payment behavior, will closely track the level
of related net charge-offs. In 2007, due to further deteriora-
tion in the outlook for the housing market, we recorded a
credit reserve build, primarily for higher loss content that
we estimated in the Home Equity portfolio. The process for
determining the adequacy of the allowance for credit losses
is critical to our financial results. It requires difficult, subjec-
tive and complex judgments, as a result of the need to make
estimates about the effect of matters that are uncertain. (See
“Financial Review – Critical Accounting Policies – Allowance
for Credit Losses.”) Therefore, we cannot provide assurance
that, in any particular period, we will not have sizeable credit
losses in relation to the amount reserved. We may need to
significantly adjust the allowance for credit losses, considering
current factors at the time, including economic or market
conditions and ongoing internal and external examination
processes. Our process for determining the adequacy of the
allowance for credit losses is discussed in “Financial Review
– Critical Accounting Policies – Allowance for Credit Losses”
and Note 6 (Loans and Allowance for Credit Losses) to
Financial Statements.
Asset/Liability and Market Risk Management
Asset/liability management involves the evaluation, monitoring
and management of interest rate risk, market risk, liquidity
and funding. The Corporate Asset/Liability Management
Committee (Corporate ALCO)—which oversees these risks
and reports periodically to the Finance Committee of the
Board of Directors—consists of senior financial and business
executives. Each of our principal business groups has indi-
vidual asset/liability management committees and processes
linked to the Corporate ALCO process.
INTEREST RATE RISK
Interest rate risk, which potentially can have a significant
earnings impact, is an integral part of being a financial
intermediary. We are subject to interest rate risk because:
• assets and liabilities may mature or reprice at different
times (for example, if assets reprice faster than liabilities
and interest rates are generally falling, earnings will
initially decline);
• assets and liabilities may reprice at the same time but by
different amounts (for example, when the general level
of interest rates is falling, we may reduce rates paid on
checking and savings deposit accounts by an amount that
is less than the general decline in market interest rates);
• short-term and long-term market interest rates may
change by different amounts (for example, the shape of
the yield curve may affect new loan yields and funding
costs differently); or
• the remaining maturity of various assets or liabilities may
shorten or lengthen as interest rates change (for example,
if long-term mortgage interest rates decline sharply,
mortgage-backed securities held in the securities available-
for-sale portfolio may prepay significantly earlier than
anticipated—which could reduce portfolio income).
Interest rates may also have a direct or indirect effect on
loan demand, credit losses, mortgage origination volume, the
fair value of MSRs and other financial instruments, the value
of the pension liability and other items affecting earnings.
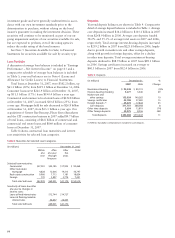
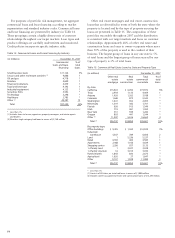
Table 18: Allocation of the Allowance for Credit Losses
(in millions) December 31,
2007 2006 2005 2004 2003
Loans Loans Loans Loans Loans
as % as % as % as % as %
of total of total of total of total of total
loans loans loans loans loans
Commercial and commercial real estate:
Commercial $1,137 24% $1,051 22% $ 926 20% $ 940 19% $ 917 19%
Other real estate mortgage 288 9 225 9 253 9 298 11 444 11
Real estate construction 156 5 109 5 115 4 46 3 63 3
Lease financing 51 2 40 2 51 2 30 2 40 2
Total commercial and commercial real estate 1,632 40 1,425 38 1,345 35 1,314 35 1,464 35
Consumer:
Real estate 1-4 family first mortgage 415 19 186 17 229 25 150 31 176 33
Real estate 1-4 family junior lien mortgage 1,329 20 168 21 118 19 104 18 92 15
Credit card 834 5 606 5 508 4 466 4 443 3
Other revolving credit and installment 1,164 14 1,434 17 1,060 15 889 11 802 13
Total consumer 3,742 58 2,394 60 1,915 63 1,609 64 1,513 64
Foreign 144 2 145 2 149 2 139 1 95 1
Total allocated 5,518 100% 3,964 100% 3,409 100% 3,062 100% 3,072 100%
Unallocated component of allowance — — 648 888 819
Total $5,518 $3,964 $4,057 $3,950 $3,891