Wells Fargo 2007 Annual Report Download - page 79
Download and view the complete annual report
Please find page 79 of the 2007 Wells Fargo annual report below. You can navigate through the pages in the report by either clicking on the pages listed below, or by using the keyword search tool below to find specific information within the annual report.-
 1
1 -
2
-
3
-
4
-
5
-
6
-
7
-
8
-
9
-
10
-
11
-
12
-
13
-
14
-
15
-
16
-
17
-
18
-
19
-
20
-
21
-
22
-
23
-
24
-
25
-
26
-
27
-
28
-
29
-
30
-
31
-
32
-
33
-
34
-
35
-
36
-
37
-
38
-
39
-
40
-
41
-
42
-
43
-
44
-
45
-
46
-
47
-
48
-
49
-
50
-
51
-
52
-
53
-
54
-
55
-
56
-
57
-
58
-
59
-
60
-
61
-
62
-
63
-
64
-
65
-
66
-
67
-
68
-
 69
69 -
 70
70 -
 71
71 -
 72
72 -
 73
73 -
 74
74 -
 75
75 -
 76
76 -
 77
77 -
 78
78 -
 79
79 -
 80
80 -
 81
81 -
 82
82 -
 83
83 -
 84
84 -
 85
85 -
 86
86 -
 87
87 -
 88
88 -
 89
89 -
90
-
91
-
92
-
93
-
94
-
95
-
96
-
97
-
98
-
99
-
100
-
101
-
102
-
103
-
104
-
105
-
106
-
107
-
108
-
109
-
110
-
111
-
112
-
113
-
114
-
115
-
116
-
117
-
118
-
119
-
120
-
121
-
122
-
123
-
124
-
125
-
126
-
127
-
128
-
129
-
130
-
131
-
132
-
133
-
134
-
135
-
136
 |
 |

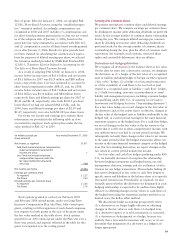
76
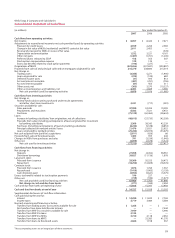
Wells Fargo & Company and Subsidiaries
Consolidated Statement of Changes in Stockholders’ Equity and Comprehensive Income
(in millions, except shares)
Number Preferred Common Additional Retained Cumulative Treasury Unearned Total
of common stock stock paid-in earnings other stock ESOP stock-
shares capital comprehensive shares holders’
income equity
BALANCE DECEMBER 31, 2004 3,389,183,274 $ 270 $ 5,788 $ 6,912 $ 26,482 $ 950 $ (2,247)$(289)$ 37,866
Comprehensive income:
Net income – 2005 7,671 7,671
Other comprehensive income, net of tax:
Translation adjustments 55
Net unrealized losses on securities available
for sale and other interests held (298) (298)
Net unrealized gains on derivatives and
hedging activities 8
8
Total comprehensive income 7,386
Common stock issued 57,528,986 (52) (198) 1,617 1,367
Common stock issued for acquisitions 3,909,004 12 110 122
Common stock repurchased (105,597,728) (3,159) (3,159)
Preferred stock (363,000) issued to ESOP 362 25 (387) —
Preferred stock released to ESOP (21) 328 307
Preferred stock (307,100) converted
to common shares 10,142,528 (307) 21 286 —
Common stock dividends (3,375) (3,375)
Tax benefit upon exercise of stock options 143 143
Other, net ______________ _____ _______ _______ _________ ______ 3 _____ 3
Net change (34,017,210) 55 — 128 4,098 (285) (1,143) (59) 2,794
BALANCE DECEMBER 31, 2005 3,355,166,064 325 5,788 7,040 30,580 665 (3,390) (348) 40,660
Cumulative effect from adoption of FAS 156 101 101
BALANCE JANUARY 1, 2006 3,355,166,064 325 5,788 7,040 30,681 665 (3,390) (348) 40,761
Comprehensive income:
Net income – 2006 8,420 8,420
Other comprehensive income, net of tax:
Net unrealized losses on securities available
for sale and other interests held (31) (31)
Net unrealized gains on derivatives and
hedging activities 70 70
Total comprehensive income 8,459
Common stock issued 70,063,930 (67) (245) 2,076 1,764
Common stock repurchased (58,534,072) (1,965) (1,965)
Preferred stock (414,000) issued to ESOP 414 29 (443) —
Preferred stock released to ESOP (25) 380 355
Preferred stock (355,659) converted
to common shares 10,453,939 (355) 41 314 —
Common stock dividends (3,641) (3,641)
Tax benefit upon exercise of stock options 229 229
Stock option compensation expense 134 134
Net change in deferred compensation and
related plans 50 (27) 23
Reclassification of share-based plans 308 (211) 97
Adoption of FAS 158 _____________ _____ ______ ______ _______ (402)_______ _____ (402)
Net change 21,983,797 59 — 699 4,534 (363) 187 (63) 5,053
BALANCE DECEMBER 31, 2006 3,377,149,861 384 5,788 7,739 35,215 302 (3,203) (411) 45,814
Cumulative effect from adoption of FSP 13-2 (71) (71)
BALANCE JANUARY 1, 2007
3,377,149,861 384 5,788 7,739 35,144 302 (3,203) (411) 45,743
Comprehensive income:
Net income – 2007 8,057 8,057
Other comprehensive income, net of tax:
Translation adjustments 23 23
Net unrealized losses on securities available
for sale and other interests held (164) (164)
Net unrealized gains on derivatives and
hedging activities 322 322
Defined benefit pension plans:
Amortization of net actuarial loss and prior
service cost included in net income 242 242
Total comprehensive income 8,480
Common stock issued 69,894,448 (132) (276) 2,284 1,876
Common stock issued for acquisitions 58,058,813 190 1,935 2,125
Common stock repurchased (220,327,473) (7,418) (7,418)
Preferred stock (484,000) issued to ESOP 484 34 (518) —
Preferred stock released to ESOP (29) 447 418
Preferred stock (418,000) converted
to common shares 12,326,559 (418) 13 405 —
Common stock dividends (3,955) (3,955)
Tax benefit upon exercise of stock options 210 210
Stock option compensation expense 129 129
Net change in deferred compensation and
related plans _____________ _____ ______ 58 _______ _____ (38) _____ 20
Net change (80,047,653) 66 — 473 3,826 423 (2,832) (71) 1,885
BALANCE DECEMBER 31, 2007 3,297,102,208 $450 $5,788 $8,212 $38,970 $ 725 $(6,035) $(482) $47,628
The accompanying notes are an integral part of these statements.