Wells Fargo 2007 Annual Report Download - page 112
Download and view the complete annual report
Please find page 112 of the 2007 Wells Fargo annual report below. You can navigate through the pages in the report by either clicking on the pages listed below, or by using the keyword search tool below to find specific information within the annual report.-
 1
1 -
2
-
3
-
4
-
5
-
6
-
7
-
8
-
9
-
10
-
11
-
12
-
13
-
14
-
15
-
16
-
17
-
18
-
19
-
20
-
21
-
22
-
23
-
24
-
25
-
26
-
27
-
28
-
29
-
30
-
31
-
32
-
33
-
34
-
35
-
36
-
37
-
38
-
39
-
40
-
41
-
42
-
43
-
44
-
45
-
46
-
47
-
48
-
49
-
50
-
51
-
52
-
53
-
54
-
55
-
56
-
57
-
58
-
59
-
60
-
61
-
62
-
63
-
64
-
65
-
66
-
67
-
68
-
69
-
70
-
71
-
72
-
73
-
74
-
75
-
76
-
77
-
78
-
79
-
80
-
81
-
82
-
83
-
84
-
85
-
86
-
87
-
88
-
89
-
90
-
91
-
92
-
93
-
94
-
95
-
96
-
97
-
98
-
99
-
100
-
101
-
 102
102 -
 103
103 -
 104
104 -
 105
105 -
 106
106 -
 107
107 -
 108
108 -
 109
109 -
 110
110 -
 111
111 -
 112
112 -
 113
113 -
 114
114 -
 115
115 -
 116
116 -
 117
117 -
 118
118 -
 119
119 -
 120
120 -
 121
121 -
 122
122 -
123
-
124
-
125
-
126
-
127
-
128
-
129
-
130
-
131
-
132
-
133
-
134
-
135
-
136
 |
 |

109
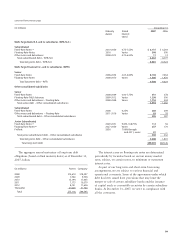
Fair Value Option
The following table reflects the differences between fair
value carrying amount of MHFS measured at fair value
under FAS 159 and the aggregate unpaid principal amount
we are contractually entitled to receive at maturity.
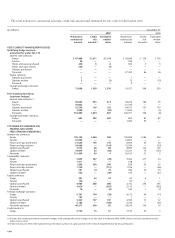
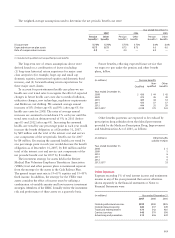
(in millions) December 31, 2007
Fair value Aggregate Fair value
carrying unpaid carrying
amount principal amount
less
aggregate
unpaid
principal
Mortgages held for sale
reported at fair value:
Total loans $24,998 $24,691 $307(1)
Nonaccrual loans 59 85 (26)
Loans 90 days or more
past due and still accruing 29 31 (2)
(1) The difference between fair value carrying amount and aggregate unpaid principal
includes changes in fair value recorded at and subsequent to funding, gains and losses
on the related loan commitment prior to funding, and premiums on acquired loans.
FAS 107, Disclosures about Fair Value of Financial Instruments
The table below is a summary of fair value estimates as of
December 31, 2007 and 2006, for financial instruments, as
defined by FAS 107, excluding short-term financial assets and
liabilities, for which carrying amounts approximate fair value,
and excluding financial instruments recorded at fair value on a
recurring basis. The carrying amounts in the following table
are recorded in the balance sheet under the indicated captions.
In accordance with FAS 107, we have not included
assets and liabilities that are not financial instruments in
our disclosure, such as the value of the long-term relationships
(in millions) Year ended December 31, 2007
Mortgages Other
held for interests
sale held
Changes in fair value
included in net income:
Mortgage banking noninterest income:
Net gains on mortgage loan
origination/sales activities (1) $986 $ —
Other noninterest income — (153)
(1) Includes changes in fair value of servicing associated with MHFS.
The assets accounted for under FAS 159 are initially measured
at fair value. Gains and losses from initial measurement and
subsequent changes in fair value are recognized in earnings. The
changes in fair values related to initial measurement and subsequent
changes in fair value that are included in current period earnings
for these assets measured at fair value are shown, by income
statement line item, below.
(in millions) December 31,
2007 2006
Carrying Estimated Carrying Estimated
amount fair value amount fair value
FINANCIAL ASSETS
Mortgages held for sale
(1)
$ 1,817 $ 1,817 $ 33,097 $ 33,240
Loans held for sale 948 955 721 731
Loans, net 376,888 377,219 315,352 315,484
Nonmarketable equity investments (cost method) 5,855 6,076 4,451 4,711
FINANCIAL LIABILITIES
Deposits $344,460 $344,484 $310,243 $310,116
Long-term debt
(2)
99,373 98,449 87,133 86,837
(1) Balance excludes mortgages held for sale for which the fair value option under FAS 159 was elected, and therefore includes nonprime residential and commercial
mortgages held for sale.
(2) The carrying amount and fair value exclude obligations under capital leases of $20 million and $12 million at December 31, 2007 and 2006, respectively.
Interest income on mortgages held for sale measured at
fair value is calculated based on the note rate of the loan and
is recorded in interest income in the income statement.
with our deposit, credit card and trust customers, amortized
MSRs, premises and equipment, goodwill and other
intangibles, deferred taxes and other liabilities. Additionally,
the amounts in the table have not been updated since year
end, therefore the valuations may have changed significantly
since that point in time. For these reasons, the total of the
fair value calculations presented does not represent, and
should not be construed to represent, the underlying value
of the Company.