Wells Fargo 2007 Annual Report Download - page 80
Download and view the complete annual report
Please find page 80 of the 2007 Wells Fargo annual report below. You can navigate through the pages in the report by either clicking on the pages listed below, or by using the keyword search tool below to find specific information within the annual report.-
 1
1 -
2
-
3
-
4
-
5
-
6
-
7
-
8
-
9
-
10
-
11
-
12
-
13
-
14
-
15
-
16
-
17
-
18
-
19
-
20
-
21
-
22
-
23
-
24
-
25
-
26
-
27
-
28
-
29
-
30
-
31
-
32
-
33
-
34
-
35
-
36
-
37
-
38
-
39
-
40
-
41
-
42
-
43
-
44
-
45
-
46
-
47
-
48
-
49
-
50
-
51
-
52
-
53
-
54
-
55
-
56
-
57
-
58
-
59
-
60
-
61
-
62
-
63
-
64
-
65
-
66
-
67
-
68
-
69
-
 70
70 -
 71
71 -
 72
72 -
 73
73 -
 74
74 -
 75
75 -
 76
76 -
 77
77 -
 78
78 -
 79
79 -
 80
80 -
 81
81 -
 82
82 -
 83
83 -
 84
84 -
 85
85 -
 86
86 -
 87
87 -
 88
88 -
 89
89 -
 90
90 -
91
-
92
-
93
-
94
-
95
-
96
-
97
-
98
-
99
-
100
-
101
-
102
-
103
-
104
-
105
-
106
-
107
-
108
-
109
-
110
-
111
-
112
-
113
-
114
-
115
-
116
-
117
-
118
-
119
-
120
-
121
-
122
-
123
-
124
-
125
-
126
-
127
-
128
-
129
-
130
-
131
-
132
-
133
-
134
-
135
-
136
 |
 |

77
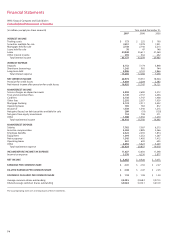
Wells Fargo & Company and Subsidiaries
Consolidated Statement of Cash Flows
(in millions) Year ended December 31,
2007 2006 2005
Cash flows from operating activities:
Net income $ 8,057 $ 8,420 $ 7,671
Adjustments to reconcile net income to net cash provided (used) by operating activities:
Provision for credit losses 4,939 2,204 2,383
Change in fair value of MSRs (residential) and MHFS carried at fair value 2,611 2,453 —
Reversal of provision for MSRs in excess of fair value —— (378)
Depreciation and amortization 1,532 3,221 4,161
Other net gains (1,407) (1,701) (1,200)
Preferred shares released to ESOP 418 355 307
Stock option compensation expense 129 134 —
Excess tax benefits related to stock option payments (196) (227) —
Originations of MHFS (223,266) (237,841) (230,897)
Proceeds from sales of and principal collected on mortgages originated for sale 216,270 238,800 213,514
Net change in:
Trading assets (3,388) 5,271 (1,905)
Loans originated for sale (222) (109) 683
Deferred income taxes (31) 593 813
Accrued interest receivable (407) (291) (796)
Accrued interest payable (87) 455 311
Other assets, net (365) 3,570 (10,237)
Other accrued expenses and liabilities, net 4,491 2,669 3,585
Net cash provided (used) by operating activities 9,078 27,976 (11,985)
Cash flows from investing activities:
Net change in:
Federal funds sold, securities purchased under resale agreements
and other short-term investments 3,331 (717) (281)
Securities available for sale:
Sales proceeds 47,990 53,304 19,059
Prepayments and maturities 8,505 7,321 6,972
Purchases (75,129) (62,462) (28,634)
Loans:
Increase in banking subsidiaries’ loan originations, net of collections (48,615) (37,730) (42,309)
Proceeds from sales (including participations) of loans originated for investment
by banking subsidiaries 3,369 38,343 42,239
Purchases (including participations) of loans by banking subsidiaries (8,244) (5,338) (8,853)
Principal collected on nonbank entities’ loans 21,476 23,921 22,822
Loans originated by nonbank entities (25,284) (26,974) (33,675)
Net cash acquired from (paid for) acquisitions (2,811) (626) 66
Proceeds from sales of foreclosed assets 1,405 593 444
Changes in MSRs from purchases and sales 791 (3,539) (1,943)
Other, net (4,099) (2,678) (3,324)
Net cash used by investing activities (77,315) (16,582) (27,417)
Cash flows from financing activities:
Net change in:
Deposits 27,058 (4,452) 38,961
Short-term borrowings 39,827 (11,156) 1,878
Long-term debt:
Proceeds from issuance 29,360 20,255 26,473
Repayment (18,250) (12,609) (18,576)
Common stock:
Proceeds from issuance 1,876 1,764 1,367
Repurchased (7,418) (1,965) (3,159)
Cash dividends paid (3,955) (3,641) (3,375)
Excess tax benefits related to stock option payments 196 227 —
Other, net (728) (186) (1,673)
Net cash provided (used) by financing activities 67,966 (11,763) 41,896
Net change in cash and due from banks (271) (369) 2,494
Cash and due from banks at beginning of year 15,028 15,397 12,903
Cash and due from banks at end of year $ 14,757 $ 15,028 $ 15,397
Supplemental disclosures of cash flow information:
Cash paid during the year for:
Interest $ 14,290 $ 11,833 $ 7,769
Income taxes 3,719 3,084 3,584
Noncash investing and financing activities:
Transfers from trading assets to securities available for sale $ 1,268 $ — $ —
Net transfers from loans held for sale to loans —— 7,444
Transfers from MHFS to securities available for sale 7,949 — 5,490
Transfers from MHFS to loans 2,133 ——
Transfers from MHFS to MSRs 3,720 4,118 2,652
Transfers from loans to MHFS —32,383 41,270
Transfers from loans to foreclosed assets 2,666 1,918 567
The accompanying notes are an integral part of these statements.