Wells Fargo 2007 Annual Report Download - page 82
Download and view the complete annual report
Please find page 82 of the 2007 Wells Fargo annual report below. You can navigate through the pages in the report by either clicking on the pages listed below, or by using the keyword search tool below to find specific information within the annual report.-
 1
1 -
2
-
3
-
4
-
5
-
6
-
7
-
8
-
9
-
10
-
11
-
12
-
13
-
14
-
15
-
16
-
17
-
18
-
19
-
20
-
21
-
22
-
23
-
24
-
25
-
26
-
27
-
28
-
29
-
30
-
31
-
32
-
33
-
34
-
35
-
36
-
37
-
38
-
39
-
40
-
41
-
42
-
43
-
44
-
45
-
46
-
47
-
48
-
49
-
50
-
51
-
52
-
53
-
54
-
55
-
56
-
57
-
58
-
59
-
60
-
61
-
62
-
63
-
64
-
65
-
66
-
67
-
68
-
69
-
70
-
71
-
 72
72 -
 73
73 -
 74
74 -
 75
75 -
 76
76 -
 77
77 -
 78
78 -
 79
79 -
 80
80 -
 81
81 -
 82
82 -
 83
83 -
 84
84 -
 85
85 -
 86
86 -
 87
87 -
 88
88 -
 89
89 -
 90
90 -
 91
91 -
 92
92 -
93
-
94
-
95
-
96
-
97
-
98
-
99
-
100
-
101
-
102
-
103
-
104
-
105
-
106
-
107
-
108
-
109
-
110
-
111
-
112
-
113
-
114
-
115
-
116
-
117
-
118
-
119
-
120
-
121
-
122
-
123
-
124
-
125
-
126
-
127
-
128
-
129
-
130
-
131
-
132
-
133
-
134
-
135
-
136
 |
 |
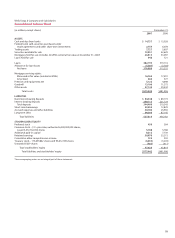
79
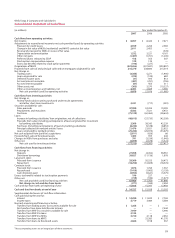
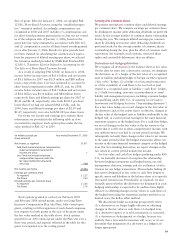
We have revised our consolidated statement of cash flows to
appropriately reflect the proceeds from sales of mortgages
held for sale (MHFS) and the related investment in MSRs as
noncash transfers from MHFS to MSRs. The impact of the
adjustments was to decrease net cash provided by operating
activities from $32,094 million to $27,976 million in 2006,
increase net cash used by operating activities from $9,333
million to $11,985 million in 2005, decrease net cash used by
investing activities from $20,700 million to $16,582 million in
2006, and decrease net cash used by investing activities from
$30,069 million to $27,417 million in 2005. These revisions
to the historical financial statements were not considered to
be material.
The following is a description of our significant
accounting policies.
Consolidation
Our consolidated financial statements include the accounts
of the Parent and our majority-owned subsidiaries and vari-
able interest entities (VIEs) (defined below) in which we are
the primary beneficiary. Significant intercompany accounts
and transactions are eliminated in consolidation. If we own
at least 20% of an entity, we generally account for the
investment using the equity method. If we own less than
20% of an entity, we generally carry the investment at cost,
except marketable equity securities, which we carry at fair
value with changes in fair value included in other compre-
hensive income. Assets accounted for under the equity or
cost method are included in other assets.
We are a variable interest holder in certain special-pur-
pose entities in which we do not have a controlling financial
interest or do not have enough equity at risk for the entity to
finance its activities without additional subordinated finan-
cial support from other parties. Our variable interest arises
from contractual, ownership or other monetary interests in
the entity, which change with fluctuations in the entity’s net
asset value. We consolidate a VIE if we are the primary ben-
eficiary because we will absorb a majority of the entity’s
expected losses, receive a majority of the entity’s expected
residual returns, or both.
Trading A ssets
Trading assets are primarily securities, including corporate
debt, U.S. government agency obligations and other securi-
ties that we acquire for short-term appreciation or other
trading purposes, and the fair value of derivatives held for
customer accommodation purposes or proprietary trading.
Trading assets are carried at fair value, with realized and
unrealized gains and losses recorded in noninterest income.
Noninterest income from trading assets was $544 million in
2007 and 2006, and $571 million in 2005.
Securities
SECURITIES AVAILABLE FOR SALE Debt securities that we might
not hold until maturity and marketable equity securities are
classified as securities available for sale and reported at estimated
fair value. Unrealized gains and losses, after applicable taxes,
are reported in cumulative other comprehensive income. Fair
value measurement is based upon quoted prices, if available.
If quoted prices are not available, fair values are measured using
independent pricing models or other model-based valuation
techniques such as the present value of future cash flows,
adjusted for the security’s credit rating, prepayment assumptions
and other factors such as credit loss assumptions.
We reduce the asset value when we consider the declines
in the value of debt securities and marketable equity securi-
ties to be other than temporary and record the estimated loss
in noninterest income. We conduct other-than-temporary
impairment analysis on a quarterly basis. The initial indica-
tor of other-than-temporary impairment for both debt and
equity securities is a decline in market value below the
amount recorded for an investment, and the severity and
duration of the decline. In determining whether an impair-
ment is other than temporary, we consider the length of time
and the extent to which market value has been less than
cost, any recent events specific to the issuer and economic
conditions of its industry, and our ability and intent to hold
the investment for a period of time sufficient to allow for
any anticipated recovery.
For marketable equity securities, we also consider the
issuer’s financial condition, capital strength, and near-term
prospects.
For debt securities we also consider:
• the cause of the price decline—general level of interest
rates and industry and issuer-specific factors;
• the issuer’s financial condition, near term prospects and
current ability to make future payments in a timely manner;
• the issuer’s ability to service debt; and
• any change in agencies’ ratings at evaluation date from
acquisition date and any likely imminent action.
The securities portfolio is an integral part of our asset/
liability management process. We manage these investments
to provide liquidity, manage interest rate risk and maximize
portfolio yield within capital risk limits approved by man-
agement and the Board of Directors and monitored by the
Corporate Asset/Liability Management Committee (Corporate
ALCO). We recognize realized gains and losses on the sale
of these securities in noninterest income using the specific
identification method.
Unamortized premiums and discounts are recognized in
interest income over the contractual life of the security using
the interest method. As principal repayments are received on
securities (i.e., primarily mortgage-backed securities) a pro-
rata portion of the unamortized premium or discount is rec-
ognized in interest income.
NONMARKETABLE EQUITY SECURITIES Nonmarketable equity
securities include venture capital equity securities that are
not publicly traded and securities acquired for various pur-
poses, such as to meet regulatory requirements (for example,
Federal Reserve Bank and Federal Home Loan Bank stock).
We review these assets at least quarterly for possible other-
than-temporary impairment. Our review typically includes
an analysis of the facts and circumstances of each invest-
ment, the expectations for the investment’s cash flows and
capital needs, the viability of its business model and our exit