Wells Fargo 2007 Annual Report Download - page 121
Download and view the complete annual report
Please find page 121 of the 2007 Wells Fargo annual report below. You can navigate through the pages in the report by either clicking on the pages listed below, or by using the keyword search tool below to find specific information within the annual report.-
 1
1 -
2
-
3
-
4
-
5
-
6
-
7
-
8
-
9
-
10
-
11
-
12
-
13
-
14
-
15
-
16
-
17
-
18
-
19
-
20
-
21
-
22
-
23
-
24
-
25
-
26
-
27
-
28
-
29
-
30
-
31
-
32
-
33
-
34
-
35
-
36
-
37
-
38
-
39
-
40
-
41
-
42
-
43
-
44
-
45
-
46
-
47
-
48
-
49
-
50
-
51
-
52
-
53
-
54
-
55
-
56
-
57
-
58
-
59
-
60
-
61
-
62
-
63
-
64
-
65
-
66
-
67
-
68
-
69
-
70
-
71
-
72
-
73
-
74
-
75
-
76
-
77
-
78
-
79
-
80
-
81
-
82
-
83
-
84
-
85
-
86
-
87
-
88
-
89
-
90
-
91
-
92
-
93
-
94
-
95
-
96
-
97
-
98
-
99
-
100
-
101
-
102
-
103
-
104
-
105
-
106
-
107
-
108
-
109
-
110
-
 111
111 -
 112
112 -
 113
113 -
 114
114 -
 115
115 -
 116
116 -
 117
117 -
 118
118 -
 119
119 -
 120
120 -
 121
121 -
 122
122 -
 123
123 -
 124
124 -
 125
125 -
 126
126 -
 127
127 -
 128
128 -
 129
129 -
 130
130 -
 131
131 -
132
-
133
-
134
-
135
-
136
 |
 |

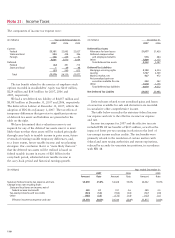
118
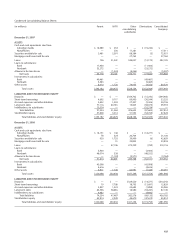
(in millions) December 31,
2007 2006
Deferred Tax Assets
Allowance for loan losses $1,977 $1,430
Deferred compensation
and employee benefits 576 484
Other 1,809 1,173
Total deferred tax assets 4,362 3,087
Deferred Tax Liabilities
Mortgage servicing rights 5,103 4,234
Leasing 1,737 2,349
Mark to market, net 427 972
Net unrealized gains on
securities available for sale 242 342
Other 1,510 1,175
Total deferred tax liabilities 9,019 9,072
Net Deferred Tax Liability $4,657 $5,985
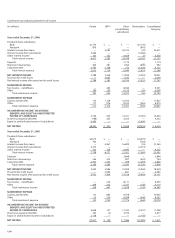
The components of income tax expense were:
The tax benefit related to the exercise of employee stock
options recorded in stockholders’ equity was $210 million,
$229 million and $143 million for 2007, 2006 and
2005, respectively.
We had a net deferred tax liability of $4,657 million and
$5,985 million at December 31, 2007 and 2006, respectively.
The deferred tax balance at December 31, 2007, reflects the
adoption of FIN 48 on January 1, 2007. The tax effects of
temporary differences that gave rise to significant portions
of deferred tax assets and liabilities are presented in the
table on the right.
We have determined that a valuation reserve is not
required for any of the deferred tax assets since it is more
likely than not that these assets will be realized principally
through carry back to taxable income in prior years, future
reversals of existing taxable temporary differences, and,
to a lesser extent, future taxable income and tax planning
strategies. Our conclusion that it is “more likely than not”
that the deferred tax assets will be realized is based on
federal taxable income in excess of $20 billion in the
carry-back period, substantial state taxable income in
the carry-back period and historical earnings growth.
Note 21: Income Taxes
(in millions) Year ended December 31,
2007 2006 2005
Current:
Federal $3,181 $2,993 $2,627
State and local 284 438 346
Foreign 136 239 91
3,601 3,670 3,064
Deferred:
Federal (32) 491 715
State and local 1 69 98
(31) 560 813
Total $3,570 $4,230 $3,877
Deferred taxes related to net unrealized gains and losses
on securities available for sale and derivatives are recorded
in cumulative other comprehensive income.
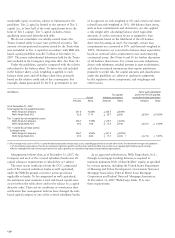
The table below reconciles the statutory federal income
tax expense and rate to the effective income tax expense
and rate.
Income tax expense for 2007 and the effective tax rate
included FIN 48 tax benefits of $235 million, as well as the
impact of lower pre-tax earnings in relation to the level of
tax-exempt income and tax credits. The tax benefits were
primarily related to the resolution of certain matters with
federal and state taxing authorities and statute expirations,
reduced by accruals for uncertain tax positions, in accordance
with FIN 48.
(in millions) Year ended December 31,
2007 2006 2005
Amount Rate Amount Rate Amount Rate
Statutory federal income tax expense and rate $4,070 35.0% $4,428 35.0% $4,042 35.0%
Change in tax rate resulting from:
State and local taxes on income, net of
federal income tax benefit 359 3.1 331 2.6 289 2.5
Tax-exempt income and tax credits (424) (3.6) (356) (2.8) (327) (2.8)
Other (435) (3.8) (173) (1.4) (127) (1.1)
Effective income tax expense and rate $3,570 30.7% $4,230 33.4% $3,877 33.6%