Wells Fargo 2007 Annual Report Download - page 38
Download and view the complete annual report
Please find page 38 of the 2007 Wells Fargo annual report below. You can navigate through the pages in the report by either clicking on the pages listed below, or by using the keyword search tool below to find specific information within the annual report.-
 1
1 -
2
-
3
-
4
-
5
-
6
-
7
-
8
-
9
-
10
-
11
-
12
-
13
-
14
-
15
-
16
-
17
-
18
-
19
-
20
-
21
-
22
-
23
-
24
-
25
-
26
-
27
-
 28
28 -
 29
29 -
 30
30 -
 31
31 -
 32
32 -
 33
33 -
 34
34 -
 35
35 -
 36
36 -
 37
37 -
 38
38 -
 39
39 -
 40
40 -
 41
41 -
 42
42 -
 43
43 -
 44
44 -
 45
45 -
 46
46 -
 47
47 -
 48
48 -
49
-
50
-
51
-
52
-
53
-
54
-
55
-
56
-
57
-
58
-
59
-
60
-
61
-
62
-
63
-
64
-
65
-
66
-
67
-
68
-
69
-
70
-
71
-
72
-
73
-
74
-
75
-
76
-
77
-
78
-
79
-
80
-
81
-
82
-
83
-
84
-
85
-
86
-
87
-
88
-
89
-
90
-
91
-
92
-
93
-
94
-
95
-
96
-
97
-
98
-
99
-
100
-
101
-
102
-
103
-
104
-
105
-
106
-
107
-
108
-
109
-
110
-
111
-
112
-
113
-
114
-
115
-
116
-
117
-
118
-
119
-
120
-
121
-
122
-
123
-
124
-
125
-
126
-
127
-
128
-
129
-
130
-
131
-
132
-
133
-
134
-
135
-
136
 |
 |
35
platform bankers. In fourth quarter 2007, we completed
the acquisition of Greater Bay Bancorp, with $7.4 billion
in assets, the third largest bank acquisition in our history,
adding to our community banking, commercial insurance
brokerage, specialty finance and trust businesses. We also
recently agreed to acquire the banking operations of United
Bancorporation of Wyoming, which will make us the largest
bank in our nation’s ninth fastest growing state.
We believe it is important to maintain a well-controlled
environment as we continue to grow our businesses. We
manage our credit risk by setting what we believe are sound
credit policies for underwriting new business, while monitor-
ing and reviewing the performance of our loan portfolio. We
manage the interest rate and market risks inherent in our
asset and liability balances within prudent ranges, while
ensuring adequate liquidity and funding. We maintain strong
capital levels to provide for future growth. Our stockholder
value has increased over time due to customer satisfaction,
strong financial results, investment in our businesses, consis-
tent execution of our business model and management of
our business risks.
Wells Fargo Bank, N.A. continued to be rated as “Aaa,”
the highest possible credit rating issued by Moody’s Investors
Service (Moody’s), and was upgraded in February 2007 to
“AAA,” the highest possible credit rating issued by Standard
& Poor’s Ratings Services (S&P). Of the more than 1,100
financial institutions and 70 national banking systems covered
by S&P globally, this upgrade makes our bank one of only
two banks worldwide to have S&P’s “AAA” credit rating.
Wells Fargo Bank, N.A. is now the only U.S. bank to have the
highest possible credit rating from both Moody’s and S&P.
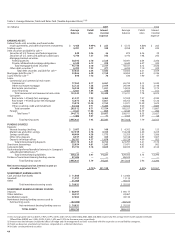
Our financial results included the following:
Net income in 2007 was $8.06 billion ($2.38 per share),
compared with $8.42 billion ($2.47 per share) in 2006.
Results for 2007 included the impact of the previously
announced $1.4 billion (pre tax) credit reserve build ($0.27
per share) and $203 million of Visa litigation expenses
($0.04 per share), and for 2006 included $95 million ($0.02
per share) of Visa litigation expenses. Despite the challenging
environment in 2007, we had a solid year and achieved both
double-digit top line revenue growth and positive operating
leverage (revenue growth of 10.4% exceeding expense
growth of 9.5%). Return on average total assets (ROA) was
1.55% and return on average stockholders’ equity (ROE)
was 17.12% in 2007, compared with 1.73% and 19.52%,
respectively, in 2006. Both ROA and ROE were, once again,
at or near the top of our large bank peers.
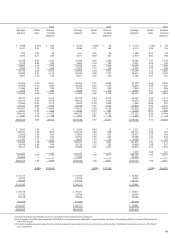
Net interest income on a taxable-equivalent basis was
$21.1 billion in 2007, up from $20.1 billion a year ago,
reflecting strong loan growth. Average earning assets grew
7% from 2006. Our net interest margin was 4.74% for 2007,
compared with 4.83% in 2006, primarily due to earning
assets increasing at a slightly faster rate than core deposits.
Noninterest income increased 17% to $18.4 billion in
2007 from $15.7 billion in 2006. The increase was across
our businesses, with double-digit increases in debit and credit
card fees (up 22%), deposit service charges (up 13%), trust
and investment fees (up 15%), and insurance revenue (up
14%). Capital markets and equity investment results were
also strong. Mortgage banking noninterest income increased
$822 million (36%) from 2006 because net servicing fee
income increased due to growth in loans serviced for others.
During 2007, noninterest income was affected by changes
in interest rates, widening credit spreads, and other credit
and housing market conditions, including:
• $(803) million – $479 million write-down of the mort-
gage warehouse/pipeline, and $324 million write-down,
primarily due to mortgage loans repurchased and an
increase in the repurchase reserve for projected early
payment defaults.
• $583 million – Increase in mortgage servicing income
reflecting a $571 million reduction in the value of mortgage
servicing rights (MSRs) due to the decline in mortgage
rates during the year, offset by a $1.15 billion gain on
the financial instruments hedging the MSRs. The ratio of
MSRs to related loans serviced for others at December 31,
2007, was 1.20%, the lowest ratio in 10 quarters.
Noninterest expense was $22.8 billion in 2007, up 9.5%
from $20.8 billion in 2006, primarily due to continued
investments in new stores and additional sales and service-
related team members. Despite these investments and the
acquisition of Greater Bay Bancorp and related integration
expense, our efficiency ratio improved to 57.9% in 2007
from 58.4% in 2006. We obtained concurrence from the
staff of the Securities and Exchange Commission (SEC)
regarding our accounting for certain transactions related to
the restructuring of Visa Inc., and recorded a litigation liabil-
ity and corresponding expense, included in operating losses,
of $203 million for 2007 and $95 million for 2006.
During 2007, net charge-offs were $3.54 billion (1.03%
of average total loans), up $1.3 billion from $2.25 billion
(0.73%) during 2006. Commercial and commercial real
estate net charge-offs increased $239 million in 2007 from
2006, of which $162 million was from loans originated
through our business direct channel. Business direct consists
primarily of unsecured lines of credit to small firms and sole
proprietors that tend to perform in a manner similar to credit
cards. Total wholesale net charge-offs (excluding business
direct) were $103 million (0.08% of average loans). The
remaining balance of commercial and commercial real estate
(other real estate mortgage, real estate construction and lease
financing) continued to have low net charge-off rates in 2007.
National Home Equity Group (Home Equity) portfolio
net charge-offs totaled $595 million (0.73% of average loans)
in 2007, compared with $110 million (0.14%) in 2006.
Because the majority of the Home Equity net charge-offs
were concentrated in the indirect or third party origination
channels, which have a higher percentage of 90% or greater
combined loan-to-value portfolios, we have discontinued third
party activities not behind a Wells Fargo first mortgage and
segregated these indirect loans into a liquidating portfolio. As
previously disclosed, while the $11.9 billion of loans in this
liquidating portfolio represented about 3% of total loans
outstanding at December 31, 2007, these loans represent