Wells Fargo 2007 Annual Report Download - page 89
Download and view the complete annual report
Please find page 89 of the 2007 Wells Fargo annual report below. You can navigate through the pages in the report by either clicking on the pages listed below, or by using the keyword search tool below to find specific information within the annual report.-
 1
1 -
2
-
3
-
4
-
5
-
6
-
7
-
8
-
9
-
10
-
11
-
12
-
13
-
14
-
15
-
16
-
17
-
18
-
19
-
20
-
21
-
22
-
23
-
24
-
25
-
26
-
27
-
28
-
29
-
30
-
31
-
32
-
33
-
34
-
35
-
36
-
37
-
38
-
39
-
40
-
41
-
42
-
43
-
44
-
45
-
46
-
47
-
48
-
49
-
50
-
51
-
52
-
53
-
54
-
55
-
56
-
57
-
58
-
59
-
60
-
61
-
62
-
63
-
64
-
65
-
66
-
67
-
68
-
69
-
70
-
71
-
72
-
73
-
74
-
75
-
76
-
77
-
78
-
 79
79 -
 80
80 -
 81
81 -
 82
82 -
 83
83 -
 84
84 -
 85
85 -
 86
86 -
 87
87 -
 88
88 -
 89
89 -
 90
90 -
 91
91 -
 92
92 -
 93
93 -
 94
94 -
 95
95 -
 96
96 -
 97
97 -
 98
98 -
 99
99 -
100
-
101
-
102
-
103
-
104
-
105
-
106
-
107
-
108
-
109
-
110
-
111
-
112
-
113
-
114
-
115
-
116
-
117
-
118
-
119
-
120
-
121
-
122
-
123
-
124
-
125
-
126
-
127
-
128
-
129
-
130
-
131
-
132
-
133
-
134
-
135
-
136
 |
 |

86
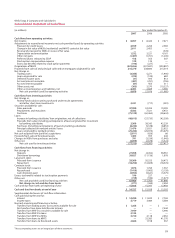
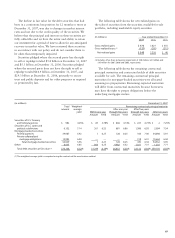
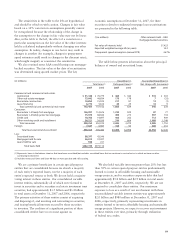
The following table shows the gross unrealized losses
and fair value of securities in the securities available-for-sale
portfolio at December 31, 2007 and 2006, by length of time
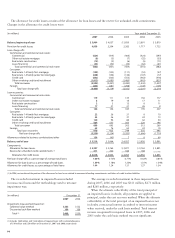
The following table provides the cost and fair value for the
major categories of securities available for sale carried at fair
value. The net unrealized gains (losses) are reported on an
Note 5: Securities Available for Sale
after-tax basis as a component of cumulative other
comprehensive income. There were no securities
classified as held to maturity as of the periods presented.
that individual securities in each category had been in a
continuous loss position.
(in millions) December 31,
2007 2006
Cost Gross Gross Fair Cost Gross Gross Fair
unrealized unrealized value unrealized unrealized value
gains losses gains losses
Securities of U.S. Treasury and federal agencies $ 962 $ 20 $ — $ 982 $ 774 $ 2 $ (8) $ 768
Securities of U.S. states and political subdivisions 6,128 135 (111) 6,152 3,387 148 (5) 3,530
Mortgage-backed securities:
Federal agencies 34,092 898 (3) 34,987 26,981 497 (15) 27,463
Private collateralized mortgage obligations (1) 20,026 82 (126) 19,982 3,989 63 (6) 4,046
Total mortgage-backed securities 54,118 980 (129) 54,969 30,970 560 (21) 31,509
Other 8,185 45 (165) 8,065 5,980 67 (21) 6,026
Total debt securities 69,393 1,180 (405) 70,168 41,111 777 (55) 41,833
Marketable equity securities 2,878 172 (267) 2,783 592 210 (6) 796
Total (2) $72,271 $1,352 $(672) $72,951 $41,703 $987 $(61) $42,629
(1) Most of the private collateralized mortgage obligations are AAA-rated bonds collateralized by 1-4 family residential first mortgages.
(2) At December 31, 2007, we held no securities of any single issuer (excluding the U.S. Treasury and federal agencies) with a book value that exceeded 10% of stockholders’ equity.
(in millions) Less than 12 months 12 months or more Total
Gross Fair Gross Fair Gross Fair
unrealized value unrealized value unrealized value
losses losses losses
December 31, 2007
Securities of U.S. Treasury and federal agencies $ — $ — $ — $ — $ — $ —
Securities of U.S. states and political subdivisions (98) 1,957 (13) 70 (111) 2,027
Mortgage-backed securities:
Federal agencies (1) 39 (2) 150 (3) 189
Private collateralized mortgage obligations (124) 7,722 (2) 54 (126) 7,776
Total mortgage-backed securities (125) 7,761 (4) 204 (129) 7,965
Other (140) 2,425 (25) 491 (165) 2,916
Total debt securities (363) 12,143 (42) 765 (405) 12,908
Marketable equity securities (266) 1,688 (1) 36 (267) 1,724
Total $(629) $13,831 $(43) $ 801 $(672) $14,632
December 31, 2006
Securities of U.S. Treasury and federal agencies $ (1) $ 164 $ (7) $ 316 $ (8) $ 480
Securities of U.S. states and political subdivisions (4) 203 (1) 90 (5) 293
Mortgage-backed securities:
Federal agencies (10) 342 (5) 213 (15) 555
Private collateralized mortgage obligations (5) 67 (1) 68 (6) 135
Total mortgage-backed securities (15) 409 (6) 281 (21) 690
Other (6) 365 (15) 558 (21) 923
Total debt securities (26) 1,141 (29) 1,245 (55) 2,386
Marketable equity securities (6) 75 — — (6) 75
Total $ (32) $ 1,216 $(29) $1,245 $ (61) $ 2,461