Wells Fargo 2007 Annual Report Download - page 60
Download and view the complete annual report
Please find page 60 of the 2007 Wells Fargo annual report below. You can navigate through the pages in the report by either clicking on the pages listed below, or by using the keyword search tool below to find specific information within the annual report.-
 1
1 -
2
-
3
-
4
-
5
-
6
-
7
-
8
-
9
-
10
-
11
-
12
-
13
-
14
-
15
-
16
-
17
-
18
-
19
-
20
-
21
-
22
-
23
-
24
-
25
-
26
-
27
-
28
-
29
-
30
-
31
-
32
-
33
-
34
-
35
-
36
-
37
-
38
-
39
-
40
-
41
-
42
-
43
-
44
-
45
-
46
-
47
-
48
-
49
-
 50
50 -
 51
51 -
 52
52 -
 53
53 -
 54
54 -
 55
55 -
 56
56 -
 57
57 -
 58
58 -
 59
59 -
 60
60 -
 61
61 -
 62
62 -
 63
63 -
 64
64 -
 65
65 -
 66
66 -
 67
67 -
 68
68 -
 69
69 -
 70
70 -
71
-
72
-
73
-
74
-
75
-
76
-
77
-
78
-
79
-
80
-
81
-
82
-
83
-
84
-
85
-
86
-
87
-
88
-
89
-
90
-
91
-
92
-
93
-
94
-
95
-
96
-
97
-
98
-
99
-
100
-
101
-
102
-
103
-
104
-
105
-
106
-
107
-
108
-
109
-
110
-
111
-
112
-
113
-
114
-
115
-
116
-
117
-
118
-
119
-
120
-
121
-
122
-
123
-
124
-
125
-
126
-
127
-
128
-
129
-
130
-
131
-
132
-
133
-
134
-
135
-
136
 |
 |

57
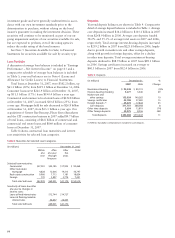
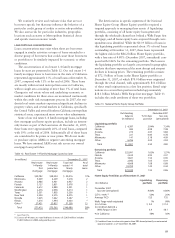
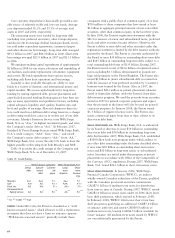
Table 16: Nonaccrual Loans and Other Assets
(in millions) December 31,
2007 2006 2005 2004 2003
Nonaccrual loans:
Commercial and commercial real estate:
Commercial $ 432 $ 331 $ 286 $ 345 $ 592
Other real estate mortgage 128 105 165 229 285
Real estate construction 293 78 31 57 56
Lease financing 45 29 45 68 73
Total commercial and commercial real estate 898 543 527 699 1,006
Consumer:
Real estate 1-4 family first mortgage (1) 1,272 688 471 386 274
Real estate 1-4 family junior lien mortgage 280 212 144 92 87
Other revolving credit and installment 184 180 171 160 88
Total consumer 1,736 1,080 786 638 449
Foreign 45 43 25 21 3
Total nonaccrual loans (2) 2,679 1,666 1,338 1,358 1,458
As a percentage of total loans 0.70% 0.52% 0.43% 0.47% 0.58%
Foreclosed assets:
GNMA loans (3) 535 322 — — —
Other 649 423 191 212 198
Real estate and other nonaccrual investments (4) 5 5 2 2 6
Total nonaccrual loans and other assets $3,868 $2,416 $1,531 $1,572 $1,662
As a percentage of total loans 1.01% 0.76% 0.49% 0.55% 0.66%
(1) Includes nonaccrual mortgages held for sale.
(2) Includes impaired loans of $469 million, $230 million, $190 million, $309 million and $629 million at December 31, 2007, 2006, 2005, 2004 and 2003, respectively.
(See Note 1 (Summary of Significant Accounting Policies) and Note 6 (Loans and Allowance for Credit Losses) to Financial Statements for further discussion of impaired loans.)
(3) Due to a change in regulatory reporting requirements effective January 1, 2006, foreclosed real estate securing GNMA loans has been classified as nonperforming.
Both principal and interest for GNMA loans secured by the foreclosed real estate are collectible because the GNMA loans are insured by the FHA or guaranteed by
the Department of Veterans Affairs.
(4) Includes real estate investments (contingent interest loans accounted for as investments) that would be classified as nonaccrual if these assets were recorded as loans.
NONACCRUAL LOANS AND OTHER ASSETS
Table 16 shows the five-year trend for nonaccrual loans and
other assets. We generally place loans on nonaccrual status
when:
• the full and timely collection of interest or principal
becomes uncertain;
• they are 90 days (120 days with respect to real estate
1-4 family first and junior lien mortgages and auto
loans) past due for interest or principal (unless both
well-secured and in the process of collection); or
• part of the principal balance has been charged off.
Note 1 (Summary of Significant Accounting Policies) to
Financial Statements describes our accounting policy for
nonaccrual loans.
Nonperforming loans increased $1.0 billion in 2007 from
2006, with the majority of the increase in the real estate 1-4
family first mortgage loan portfolio (including $209 million
in Home Mortgage and $343 million in Wells Fargo Financial
real estate) due to the deteriorating conditions in the residential
real estate market and the national rise in mortgage default
rates. Additionally, a portion of the increase related to loan
growth. The increase in the commercial and commercial real
estate portfolios was influenced by the deterioration of credits
related to the residential real estate and construction industries.
In addition, due to illiquid market conditions, we are now
holding more foreclosed properties than we have historically.
As a result, other foreclosed asset balances increased $226 million
in 2007 (including $128 million from Home Equity and
$52 million in Wells Fargo Financial real estate).
We expect that the amount of nonaccrual loans will
change due to portfolio growth, portfolio seasoning, routine
problem loan recognition and resolution through collections,
sales or charge-offs. The performance of any one loan can
be affected by external factors, such as economic or market
conditions, or factors particular to a borrower, such as
actions of a borrower’s management.
If interest due on the book balances of all nonaccrual
loans (including loans that were but are no longer on nonac-
crual at year end) had been accrued under the original terms,
approximately $165 million of interest would have been
recorded in 2007, compared with payments of $47 million
recorded as interest income.
Substantially all of the foreclosed assets at December 31,
2007, have been in the portfolio one year or less.