Wells Fargo 2007 Annual Report Download - page 54
Download and view the complete annual report
Please find page 54 of the 2007 Wells Fargo annual report below. You can navigate through the pages in the report by either clicking on the pages listed below, or by using the keyword search tool below to find specific information within the annual report.-
 1
1 -
2
-
3
-
4
-
5
-
6
-
7
-
8
-
9
-
10
-
11
-
12
-
13
-
14
-
15
-
16
-
17
-
18
-
19
-
20
-
21
-
22
-
23
-
24
-
25
-
26
-
27
-
28
-
29
-
30
-
31
-
32
-
33
-
34
-
35
-
36
-
37
-
38
-
39
-
40
-
41
-
42
-
43
-
 44
44 -
 45
45 -
 46
46 -
 47
47 -
 48
48 -
 49
49 -
 50
50 -
 51
51 -
 52
52 -
 53
53 -
 54
54 -
 55
55 -
 56
56 -
 57
57 -
 58
58 -
 59
59 -
 60
60 -
 61
61 -
 62
62 -
 63
63 -
 64
64 -
65
-
66
-
67
-
68
-
69
-
70
-
71
-
72
-
73
-
74
-
75
-
76
-
77
-
78
-
79
-
80
-
81
-
82
-
83
-
84
-
85
-
86
-
87
-
88
-
89
-
90
-
91
-
92
-
93
-
94
-
95
-
96
-
97
-
98
-
99
-
100
-
101
-
102
-
103
-
104
-
105
-
106
-
107
-
108
-
109
-
110
-
111
-
112
-
113
-
114
-
115
-
116
-
117
-
118
-
119
-
120
-
121
-
122
-
123
-
124
-
125
-
126
-
127
-
128
-
129
-
130
-
131
-
132
-
133
-
134
-
135
-
136
 |
 |

51
Off-Balance Sheet Arrangements and Aggregate Contractual Obligations
Off-Balance Sheet Arrangements, Variable Interest
Entities, Guarantees and Other Commitments
We consolidate our majority-owned subsidiaries and variable
interest entities in which we are the primary beneficiary.
Generally, we use the equity method of accounting if we own
at least 20% of an entity and we carry the investment at cost
if we own less than 20% of an entity. See Note 1 (Summary
of Significant Accounting Policies) to Financial Statements
for our consolidation policy.
In the ordinary course of business, we engage in financial
transactions that are not recorded in the balance sheet, or may
be recorded in the balance sheet in amounts that are different
from the full contract or notional amount of the transaction.
These transactions are designed to (1) meet the financial needs
of customers, (2) manage our credit, market or liquidity risks,
(3) diversify our funding sources, or (4) optimize capital,
and are accounted for in accordance with U.S. GAAP.
We have largely avoided many of the industry issues
associated with collateralized debt obligations (CDOs) and
structured investment vehicles (SIVs). A CDO is a security
backed by pools of assets, which may include debt securities,
including bonds (collateralized bond obligations, or CBOs)
or loans (collateralized loan obligations, or CLOs). CDOs
often can have reinvestment periods in which they can trade
assets and/or reinvest asset sales or liquidation proceeds. Like
collateralized mortgage obligations, CDOs issue tranches of
debt with different maturities and risk characteristics. We
typically have not engaged in creating or sponsoring SIVs to
hold off-balance sheet assets and we have not made a market
in subprime securities.
Almost all of our off-balance sheet arrangements result
from securitizations. We routinely securitize home mortgage
loans and, from time to time, other financial assets, including
commercial mortgages. We normally structure loan securitiza-
tions as sales, in accordance with FAS 140, Accounting for
Transfers and Servicing of Financial Assets and Extinguishment
of Liabilities – a replacement of FASB Statement No. 125. This
involves the transfer of financial assets to certain qualifying
special-purpose entities that we are not required to consolidate.
In a securitization, we can convert the assets into cash earlier
than if we held the assets to maturity. Special-purpose entities
used in these types of securitizations obtain cash to acquire
assets by issuing securities to investors. In a securitization,
we record a liability related to standard representations and
warranties we make to purchasers and issuers for receivables
transferred. Also, we generally retain the right to service the
transferred receivables and to repurchase those receivables
from the special-purpose entity if the outstanding balance
of the receivable falls to a level where the cost exceeds the
benefits of servicing such receivables.
At December 31, 2007, securitization arrangements
sponsored by the Company consisted of $224 billion in
securitized loan receivables, including $135 billion of home
mortgage loans and $89 billion of commercial mortgages.
At December 31, 2007, the retained servicing rights and other
interests held related to these securitizations were $10.8 billion,
consisting of $8.8 billion in securities, $1.5 billion in servic-
ing assets and $413 million in other interests held. Related
to our securitizations, we have committed to provide up to
$21 million in credit enhancements.
We have investments in certain special-purpose entities,
generally created by other sponsoring organizations, where we
hold variable interests greater than 20% but less than 50%
(significant variable interests). These special-purpose entities
were predominantly formed to invest in affordable housing
and sustainable energy projects and to securitize corporate
debt and had approximately $5.8 billion in total assets at
December 31, 2007, including $960 million related to CDOs.
We are not required to consolidate these entities. Our maximum
exposure to loss as a result of our involvement with these
unconsolidated variable interest entities was approximately
$2.0 billion at December 31, 2007, primarily representing
investments in entities formed to invest in affordable housing
and sustainable energy projects. However, we expect to recov-
er our investment in these entities over time primarily through
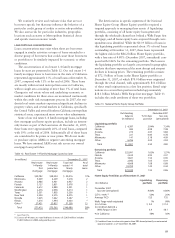
realization of federal tax credits. Our investments in CDOs,
including those special-purpose entities where we hold signifi-
cant variable interests, totaled $860 million at December 31,
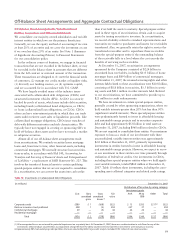
2007. Table 10 reflects these investments, including the corre-
sponding asset collateral categories and related credit ratings.
Table 10: Investments in Collateralized Debt Obligations
(in millions) December 31, 2007
Distribution of fair value by rating category
Investment grade
Cost Gross Gross Fair AAA AA to Other Total
unrealized unrealized value BBB-
gains losses (1)
Corporate credit $589 $ 1 $(68) $522 $ 13 $292 $217(2) $522
Bank or insurance trust preferred 298 1 (5) 294 257 37 — 294
Commercial mortgage 49 — (5) 44 24 20 — 44
Residential mortgage — — — — — — — —
Total $936 $ 2 $(78) $860 $294 $349 $217 $860
(1) All unrecognized losses are reviewed for potential impairment on a quarterly basis. At December 31, 2007, there was no deterioration in cash flows for any of the
investments reflected above and, therefore, no impairment charge. We have the ability and the intent to hold these investments until maturity or recovery.
(2) Approximately 90% had underlying credit portfolios that were selected by Wells Fargo credit analysts. Included $192 million of non-rated securities.