Wells Fargo 2007 Annual Report Download - page 43
Download and view the complete annual report
Please find page 43 of the 2007 Wells Fargo annual report below. You can navigate through the pages in the report by either clicking on the pages listed below, or by using the keyword search tool below to find specific information within the annual report.-
 1
1 -
2
-
3
-
4
-
5
-
6
-
7
-
8
-
9
-
10
-
11
-
12
-
13
-
14
-
15
-
16
-
17
-
18
-
19
-
20
-
21
-
22
-
23
-
24
-
25
-
26
-
27
-
28
-
29
-
30
-
31
-
32
-
 33
33 -
 34
34 -
 35
35 -
 36
36 -
 37
37 -
 38
38 -
 39
39 -
 40
40 -
 41
41 -
 42
42 -
 43
43 -
 44
44 -
 45
45 -
 46
46 -
 47
47 -
 48
48 -
 49
49 -
 50
50 -
 51
51 -
 52
52 -
 53
53 -
54
-
55
-
56
-
57
-
58
-
59
-
60
-
61
-
62
-
63
-
64
-
65
-
66
-
67
-
68
-
69
-
70
-
71
-
72
-
73
-
74
-
75
-
76
-
77
-
78
-
79
-
80
-
81
-
82
-
83
-
84
-
85
-
86
-
87
-
88
-
89
-
90
-
91
-
92
-
93
-
94
-
95
-
96
-
97
-
98
-
99
-
100
-
101
-
102
-
103
-
104
-
105
-
106
-
107
-
108
-
109
-
110
-
111
-
112
-
113
-
114
-
115
-
116
-
117
-
118
-
119
-
120
-
121
-
122
-
123
-
124
-
125
-
126
-
127
-
128
-
129
-
130
-
131
-
132
-
133
-
134
-
135
-
136
 |
 |
40
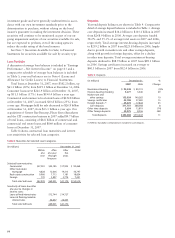
losses associated with consumer loans, management believes
that the provision for credit losses for consumer loans, absent
any significant credit event, severe decrease in collateral values,
significant acceleration of losses or significant change in
payment behavior, will closely track the level of related net
charge-offs. From time to time, events or economic factors
may impact the loan portfolio, causing management to
provide additional amounts or release balances from the
allowance for credit losses. The increase in the allowance for
credit losses in excess of net charge-offs in 2007 was primarily
due to higher losses in the Home Equity portfolio stemming
from the steeper than anticipated decline in national home
prices. See Note 6 (Loans and Allowance for Credit Losses)
to Financial Statements and “Risk Management – Credit
Risk Management Process” for further discussion of our
allowance for credit losses.
Valuation of Residential Mortgage Servicing Rights
We recognize as assets the rights to service mortgage loans
for others, or mortgage servicing rights (MSRs), whether we
purchase the servicing rights, or the servicing rights result
from the sale or securitization of loans we originate (asset
transfers). We also acquire MSRs under co-issuer agreements
that provide for us to service loans that are originated and
securitized by third-party correspondents. Effective January 1,
2006, under FAS 156, Accounting for Servicing of Financial
Assets – an amendment of FASB Statement No. 140, we
elected to initially measure and carry our MSRs related to
residential mortgage loans (residential MSRs) using the fair
value measurement method. Under this method, purchased
MSRs and MSRs from asset transfers are capitalized and
carried at fair value. Prior to the adoption of FAS 156, we
capitalized purchased residential MSRs at cost, and MSRs
from asset transfers based on the relative fair value of the
servicing right and the residential mortgage loan at the time
of sale, and carried both purchased MSRs and MSRs from
asset transfers at the lower of cost or market value. Effective
January 1, 2006, upon the remeasurement of our residential
MSRs at fair value, we recorded a cumulative effect adjust-
ment to increase the 2006 beginning balance of retained
earnings by $101 million after tax ($158 million pre tax)
in stockholders’ equity.
At the end of each quarter, we determine the fair value
of MSRs using a valuation model that calculates the present
value of estimated future net servicing income. The model
incorporates assumptions that market participants use in
estimating future net servicing income, including estimates
of prepayment speeds (including housing price volatility),
discount rate, default rates, cost to service (including delin-
quency and foreclosure costs), escrow account earnings, con-
tractual servicing fee income, ancillary income and late fees.
The valuation of MSRs is discussed further in this section
and in Note 1 (Summary of Significant Accounting Policies),
Note 8 (Securitizations and Variable Interest Entities), Note
9 (Mortgage Banking Activities) and Note 17 (Fair Values
of Assets and Liabilities) to Financial Statements.
To reduce the sensitivity of earnings to interest rate and
market value fluctuations, we may use securities available for
sale and free-standing derivatives (economic hedges) to hedge
the risk of changes in the fair value of MSRs, with the resulting
gains or losses reflected in income. Changes in the fair value of
the MSRs from changing mortgage interest rates are generally
offset by gains or losses in the fair value of the derivatives
depending on the amount of MSRs we hedge and the partic-
ular instruments chosen to hedge the MSRs. We may choose
not to fully hedge MSRs, partly because origination volume
tends to act as a “natural hedge.” For example, as interest
rates decline, servicing values generally decrease and fees
from origination volume tend to increase. Conversely, as
interest rates increase, the fair value of the MSRs generally
increases, while fees from origination volume tend to decline.
See “Mortgage Banking Interest Rate and Market Risk” for
discussion of the timing of the effect of changes in mortgage
interest rates.
Net servicing income, a component of mortgage banking
noninterest income, includes the changes from period to
period in fair value of both our residential MSRs and the
free-standing derivatives (economic hedges) used to hedge
our residential MSRs. Changes in the fair value of residential
MSRs from period to period result from (1) changes in the
valuation model inputs or assumptions (principally reflecting
changes in discount rates and prepayment speed assumptions,
mostly due to changes in interest rates) and (2) other changes,
representing changes due to collection/realization of expected
cash flows.
We use a dynamic and sophisticated model to estimate
the value of our MSRs. The model is validated by an
independent internal model validation group operating in
accordance with Company policies. Senior management
reviews all significant assumptions quarterly. Mortgage loan
prepayment speed—a key assumption in the model —is the
annual rate at which borrowers are forecasted to repay their
mortgage loan principal. The discount rate used to determine
the present value of estimated future net servicing income—
another key assumption in the model—is the required rate
of return investors in the market would expect for an asset
with similar risk. To determine the discount rate, we
consider the risk premium for uncertainties from servicing
operations (e.g., possible changes in future servicing costs,
ancillary income and earnings on escrow accounts). Both
assumptions can, and generally will, change quarterly as
market conditions and interest rates change. For example,
an increase in either the prepayment speed or discount rate
assumption results in a decrease in the fair value of the
MSRs, while a decrease in either assumption would result
in an increase in the fair value of the MSRs. In recent years,
there have been significant market-driven fluctuations in
loan prepayment speeds and the discount rate. These
fluctuations can be rapid and may be significant in the
future. Therefore, estimating prepayment speeds within a
range that market participants would use in determining the
fair value of MSRs requires significant management judgment.