Wells Fargo 2007 Annual Report Download - page 46
Download and view the complete annual report
Please find page 46 of the 2007 Wells Fargo annual report below. You can navigate through the pages in the report by either clicking on the pages listed below, or by using the keyword search tool below to find specific information within the annual report.-
 1
1 -
2
-
3
-
4
-
5
-
6
-
7
-
8
-
9
-
10
-
11
-
12
-
13
-
14
-
15
-
16
-
17
-
18
-
19
-
20
-
21
-
22
-
23
-
24
-
25
-
26
-
27
-
28
-
29
-
30
-
31
-
32
-
33
-
34
-
35
-
 36
36 -
 37
37 -
 38
38 -
 39
39 -
 40
40 -
 41
41 -
 42
42 -
 43
43 -
 44
44 -
 45
45 -
 46
46 -
 47
47 -
 48
48 -
 49
49 -
 50
50 -
 51
51 -
 52
52 -
 53
53 -
 54
54 -
 55
55 -
 56
56 -
57
-
58
-
59
-
60
-
61
-
62
-
63
-
64
-
65
-
66
-
67
-
68
-
69
-
70
-
71
-
72
-
73
-
74
-
75
-
76
-
77
-
78
-
79
-
80
-
81
-
82
-
83
-
84
-
85
-
86
-
87
-
88
-
89
-
90
-
91
-
92
-
93
-
94
-
95
-
96
-
97
-
98
-
99
-
100
-
101
-
102
-
103
-
104
-
105
-
106
-
107
-
108
-
109
-
110
-
111
-
112
-
113
-
114
-
115
-
116
-
117
-
118
-
119
-
120
-
121
-
122
-
123
-
124
-
125
-
126
-
127
-
128
-
129
-
130
-
131
-
132
-
133
-
134
-
135
-
136
 |
 |

43
Earnings Performance
Net Interest Income
Net interest income is the interest earned on debt securities,
loans (including yield-related loan fees) and other interest-
earning assets minus the interest paid for deposits and long-
term and short-term debt. The net interest margin is the
average yield on earning assets minus the average interest
rate paid for deposits and our other sources of funding.
Net interest income and the net interest margin are presented
on a taxable-equivalent basis to consistently reflect income
from taxable and tax-exempt loans and securities based
on a 35% federal statutory tax rate.
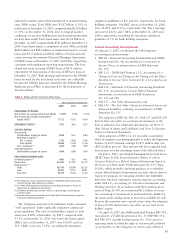
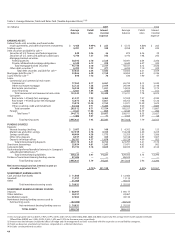
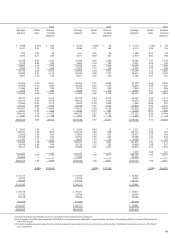
Net interest income on a taxable-equivalent basis was
$21.1 billion in 2007, up 5% from $20.1 billion in 2006.
Our net interest margin decreased to 4.74% for 2007 from
4.83% for 2006. Both the increase in net interest income and
the decrease in the net interest margin were largely driven by
strong growth in earning assets which were up 7% in 2007.
Average earning assets increased $30.1 billion to
$445.9 billion in 2007 from $415.8 billion in 2006.
Average loans increased to $344.8 billion in 2007 from
$306.9 billion in 2006. Average mortgages held for sale
decreased to $33.1 billion in 2007 from $42.9 billion in
2006. Average debt securities available for sale increased
to $57.0 billion in 2007 from $53.6 billion in 2006.
Core deposits are an important contributor to growth
in net interest income and the net interest margin, and are
a low-cost source of funding. Core deposits are noninterest-
bearing deposits, interest-bearing checking, savings certifi-
cates, market rate and other savings, and certain foreign
deposits (Eurodollar sweep balances). We have one of the
largest bases of core deposits among large U.S. banks.
Average core deposits grew 13% to $303.1 billion in 2007
from $268.9 billion in 2006 and funded 88% of average
total loans in both years. Total average retail core deposits,
which exclude Wholesale Banking core deposits and retail
mortgage escrow deposits, for 2007 grew $12.9 billion (6%)
from 2006. Average mortgage escrow deposits increased to
$21.5 billion in 2007 from $18.2 billion in 2006. Average
savings certificates of deposit increased to $40.5 billion in
2007 from $32.4 billion in 2006 and average noninterest-
bearing checking accounts and other core deposit categories
(interest-bearing checking and market rate and other savings)
increased to $241.9 billion in 2007 from $227.7 billion in
2006. Total average interest-bearing deposits increased to
$239.2 billion in 2007 from $223.8 billion in 2006, due to
a shift in the deposit mix in favor of higher-yielding savings
and certificates of deposit relative to lower cost savings and
demand deposit accounts.
Table 3 presents the individual components of net interest
income and the net interest margin.
The income tax laws of the jurisdictions in which we
operate are complex and subject to different interpretations
by the taxpayer and the relevant government taxing authorities.
In establishing a provision for income tax expense, we must
make judgments and interpretations about the application
of these inherently complex tax laws. We must also make
estimates about when in the future certain items will affect
taxable income in the various tax jurisdictions by the
government taxing authorities, both domestic and foreign.
Our interpretations may be subjected to review during
examination by taxing authorities and disputes may arise
over the respective tax positions. We attempt to resolve these
disputes during the tax examination and audit process and
ultimately through the court systems when applicable.
We monitor relevant tax authorities and revise our
estimate of accrued income taxes due to changes in income
tax laws and their interpretation by the courts and regulatory
authorities on a quarterly basis. Revisions of our estimate
of accrued income taxes also may result from our own
income tax planning and from the resolution of income
tax controversies. Such revisions in our estimates may be
material to our operating results for any given quarter.
See Note 21 (Income Taxes) to Financial Statements for
a further description of our provision for income taxes and
related income tax assets and liabilities.