Wells Fargo 2007 Annual Report Download - page 51
Download and view the complete annual report
Please find page 51 of the 2007 Wells Fargo annual report below. You can navigate through the pages in the report by either clicking on the pages listed below, or by using the keyword search tool below to find specific information within the annual report.-
 1
1 -
2
-
3
-
4
-
5
-
6
-
7
-
8
-
9
-
10
-
11
-
12
-
13
-
14
-
15
-
16
-
17
-
18
-
19
-
20
-
21
-
22
-
23
-
24
-
25
-
26
-
27
-
28
-
29
-
30
-
31
-
32
-
33
-
34
-
35
-
36
-
37
-
38
-
39
-
40
-
 41
41 -
 42
42 -
 43
43 -
 44
44 -
 45
45 -
 46
46 -
 47
47 -
 48
48 -
 49
49 -
 50
50 -
 51
51 -
 52
52 -
 53
53 -
 54
54 -
 55
55 -
 56
56 -
 57
57 -
 58
58 -
 59
59 -
 60
60 -
 61
61 -
62
-
63
-
64
-
65
-
66
-
67
-
68
-
69
-
70
-
71
-
72
-
73
-
74
-
75
-
76
-
77
-
78
-
79
-
80
-
81
-
82
-
83
-
84
-
85
-
86
-
87
-
88
-
89
-
90
-
91
-
92
-
93
-
94
-
95
-
96
-
97
-
98
-
99
-
100
-
101
-
102
-
103
-
104
-
105
-
106
-
107
-
108
-
109
-
110
-
111
-
112
-
113
-
114
-
115
-
116
-
117
-
118
-
119
-
120
-
121
-
122
-
123
-
124
-
125
-
126
-
127
-
128
-
129
-
130
-
131
-
132
-
133
-
134
-
135
-
136
 |
 |
48
We continued to build our business with investments in addi-
tional team members, largely sales and service professionals,
and new banking stores in 2007. The 10% increase in non-
interest expense to $22.8 billion in 2007 from $20.8 billion
in 2006 was due primarily to the increase in salaries, incen-
tive compensation and employee benefits. We grew our sales
and service force by adding 1,755 team members (full-time
equivalents), including 578 retail platform bankers. In 2007,
we opened 87 regional banking stores and converted 42
stores acquired from Placer Sierra Bancshares and National
City Bank to our network. The acquisition of Greater Bay
Bancorp added $87 million of expenses in 2007. Expenses
also included stock option expense of $129 million in 2007,
compared with $134 million in 2006. In addition, expenses
in 2007 included $433 million in origination costs that, prior
to the adoption of FAS 159, would have been deferred and
recognized as a reduction of net gains on mortgage loan
origination/sales activities at the time of sale.
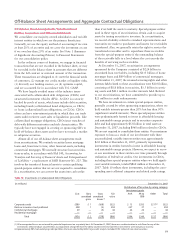
Operating losses included $203 million for 2007 and
$95 million for 2006 of litigation expenses associated with
indemnification obligations arising from our ownership
interest in Visa.
Wells Fargo is a member of the Visa USA network. On
October 3, 2007, the Visa organization of affiliated entities
completed a series of global restructuring transactions to
combine its affiliated operating companies, including Visa
USA, under a single holding company, Visa Inc. Visa Inc.
intends to issue and sell a majority of its shares to the public
in an initial public offering (IPO). We have an approximate
2.8% ownership interest in Visa Inc., which is included in
our balance sheet at a nominal amount.
We obtained concurrence from the staff of the SEC
concerning our accounting for the Visa restructuring transac-
tions, including (1) judgment sharing agreements previously
executed among the Company, Visa Inc. and its predecessors
(collectively Visa) and certain other member banks of the
Visa USA network, (2) litigation, and (3) an escrow account
that will be established by Visa Inc. at the time of its IPO.
The escrow account will be funded from IPO proceeds and
will be used to make payments related to Visa litigation. We
recorded litigation liabilities associated with indemnification
obligations related to agreements entered into during second
quarter 2006 and third quarter 2007. Based on our propor-
tionate membership share of Visa USA, we recorded a litiga-
tion liability and corresponding expense of $95 million for
2006 and $203 million for 2007. The effect to the second
quarter 2006 was estimated based upon our share of an
actual settlement reached in November 2007. Management
does not believe that the fair value of this obligation if deter-
mined in second quarter 2006 would have been materially
different given information available at that time. Management
has concluded, and the Audit and Examination Committee
of our Board of Directors has concurred, that these amounts
are immaterial to the periods affected.
Upon completion of Visa Inc.’s IPO, we will account for
the funding of the escrow account by reducing our litigation
liability with a corresponding credit to noninterest expense
for our portion of the escrow account, consistent with the
method of allocating joint and several liability among poten-
tially responsible parties in American Institute of Certified
Public Accountants Statement of Position 96-1, Environmental
Remediation Liabilities.
Income Tax Expense
On January 1, 2007, we adopted FASB Interpretation No.
48, Accounting for Uncertainty in Income Taxes (FIN 48).
Implementation of FIN 48 did not result in a cumulative
effect adjustment to retained earnings. At January 1, 2007,
the total amount of unrecognized tax benefits and accrued
interest was $3.1 billion, of which $1.7 billion related to tax
benefits and interest that, if recognized, would impact the
annual effective tax rate. Our effective tax rate for 2007 was
30.7%, compared with 33.4% for 2006. Income tax expense
and the related effective tax rate for 2007 included FIN 48
tax benefits of $235 million, as well as the impact of lower
pre-tax earnings in relation to the level of tax-exempt
income and tax credits. The tax benefits were primarily
related to the resolution of certain matters with federal and
state taxing authorities and statute expirations, reduced by
accruals for uncertain tax positions, in accordance with FIN
48. We expect that FIN 48 will cause more volatility in our
effective tax rate from quarter to quarter as we are now
required to recognize tax positions in our financial state-
ments based on the probability of ultimately sustaining such
positions with the respective taxing authorities, and we are
required to reassess those positions each quarter based on
our evaluation of new information.
Operating Segment Results
We have three lines of business for management reporting:
Community Banking, Wholesale Banking and Wells Fargo
Financial. For a more complete description of our operating
segments, including additional financial information and the
underlying management accounting process, see Note 24
(Operating Segments) to Financial Statements.
To reflect a change in the allocation of income taxes for
management reporting adopted in 2007, results for prior
periods have been revised.
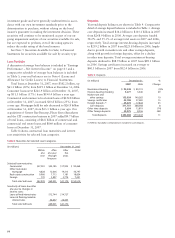
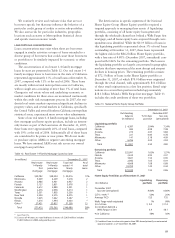
COMMUNITY BANKING’S net income decreased 5% to $5.29 billion
in 2007 from $5.55 billion in 2006. Strong sales and revenue
growth combined with disciplined expense management
were offset by higher credit costs, including the $1.4 billion
(pre tax) credit reserve build. Revenue increased 11% to
$25.54 billion from $23.03 billion in 2006. Net interest
income increased 2% to $13.37 billion in 2007 from
$13.12 billion in 2006. Although the net interest margin
declined 3 basis points to 4.75% (primarily due to lower
investment yields), the 3% growth in earning assets more
than offset the impact of the lower margin. The growth in
earning assets was predominantly driven by loan growth.
Average loans were up 9% to $194.0 billion in 2007 from
$178.0 billion in 2006. Average core deposits were up 7%
to $249.8 billion in 2007 from $233.5 billion a year ago.