Wells Fargo 2007 Annual Report Download - page 111
Download and view the complete annual report
Please find page 111 of the 2007 Wells Fargo annual report below. You can navigate through the pages in the report by either clicking on the pages listed below, or by using the keyword search tool below to find specific information within the annual report.-
 1
1 -
2
-
3
-
4
-
5
-
6
-
7
-
8
-
9
-
10
-
11
-
12
-
13
-
14
-
15
-
16
-
17
-
18
-
19
-
20
-
21
-
22
-
23
-
24
-
25
-
26
-
27
-
28
-
29
-
30
-
31
-
32
-
33
-
34
-
35
-
36
-
37
-
38
-
39
-
40
-
41
-
42
-
43
-
44
-
45
-
46
-
47
-
48
-
49
-
50
-
51
-
52
-
53
-
54
-
55
-
56
-
57
-
58
-
59
-
60
-
61
-
62
-
63
-
64
-
65
-
66
-
67
-
68
-
69
-
70
-
71
-
72
-
73
-
74
-
75
-
76
-
77
-
78
-
79
-
80
-
81
-
82
-
83
-
84
-
85
-
86
-
87
-
88
-
89
-
90
-
91
-
92
-
93
-
94
-
95
-
96
-
97
-
98
-
99
-
100
-
 101
101 -
 102
102 -
 103
103 -
 104
104 -
 105
105 -
 106
106 -
 107
107 -
 108
108 -
 109
109 -
 110
110 -
 111
111 -
 112
112 -
 113
113 -
 114
114 -
 115
115 -
 116
116 -
 117
117 -
 118
118 -
 119
119 -
 120
120 -
 121
121 -
122
-
123
-
124
-
125
-
126
-
127
-
128
-
129
-
130
-
131
-
132
-
133
-
134
-
135
-
136
 |
 |

108
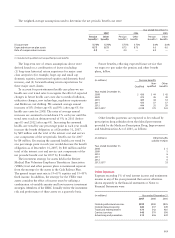
Assets and Liabilities Recorded at Fair Value on a
Nonrecurring Basis
We may be required, from time to time, to measure certain
assets at fair value on a nonrecurring basis in accordance with
GAAP. These adjustments to fair value usually result from
application of lower-of-cost-or-market accounting or write-
downs of individual assets. The valuation methodologies
used to measure these fair value adjustments are described
previously in this Note. For assets measured at fair value
on a nonrecurring basis in 2007 that were still held in the
balance sheet at year end, the following table provides
the level of valuation assumptions used to determine each
adjustment and the carrying value of the related individual
assets or portfolios at year end.
(in millions) Year ended
Carrying value at December 31, 2007 December 31, 2007
Total Level 1 Level 2 Level 3 Total
losses
Mortgages held for sale $1,817 $— $1,817 $— $ (76)
Loans held for sale 691 — 691 — (35)
Loans (1) 816 — 804 12 (3,080)
Private equity investments 22 — — 22 (52)
Foreclosed assets (2) 454 — 454 — (90)
Operating lease assets 49 — 49 — (3)
$(3,336)
(1) Represents carrying value and related write-downs of loans for which adjustments are based on the appraised value of the collateral. The carrying value of loans fully
charged-off, which includes auto loans and unsecured lines and loans, is zero.
(2) Represents the fair value and related losses of foreclosed real estate and other collateral owned that were measured at fair value subsequent to their initial classification
as foreclosed assets.
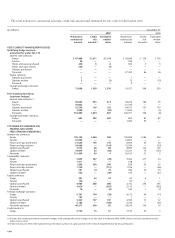
The changes in Level 3 assets and liabilities measured at fair value on a recurring basis are summarized as follows:
(in millions) Year ended December 31, 2007
Trading Securities Mortgages Mortgage Net Other
assets available held for servicing derivative liabilities
(excluding for sale sale rights assets and (excluding
derivatives) (residential) liabilities derivatives)
Balance, beginning of year $ 360 $3,447 $ — $17,591 $ (68) $(282)
Total net gains (losses) for the year included in:
Net income (151) (33) 1 (3,597) (108) (97)
Other comprehensive income —(12)————
Purchases, sales, issuances and settlements, net 207 1,979 30 2,769 178 99
Net transfers into/out of Level 3 2 — 115(3) — 4 —
Balance, end of year $ 418 $5,381 $146 $16,763 $ 6 $(280)
Net unrealized gains (losses) included in net income
for the year relating to assets and liabilities held
at December 31, 2007 (1) $ (86)(2) $ (31) $ 1(4) $ (594)(4)(5) $6
(4) $ (98)(4)
(1) Represents only net gains (losses) that are due to changes in economic conditions and management’s estimates of fair value and excludes changes due to the
collection/realization of cash flows over time.
(2) Included in other noninterest income in the income statement.
(3) Represents loans previously classified as Level 2 that became unsaleable during 2007; therefore the fair value measurement was derived from discounted cash flow
models using unobservable inputs and assumptions.
(4) Included in mortgage banking in the income statement.
(5) Represents total unrealized losses of $571 million, net of gains of $23 million related to sales, for 2007.