Wells Fargo 2007 Annual Report Download - page 39
Download and view the complete annual report
Please find page 39 of the 2007 Wells Fargo annual report below. You can navigate through the pages in the report by either clicking on the pages listed below, or by using the keyword search tool below to find specific information within the annual report.-
 1
1 -
2
-
3
-
4
-
5
-
6
-
7
-
8
-
9
-
10
-
11
-
12
-
13
-
14
-
15
-
16
-
17
-
18
-
19
-
20
-
21
-
22
-
23
-
24
-
25
-
26
-
27
-
28
-
 29
29 -
 30
30 -
 31
31 -
 32
32 -
 33
33 -
 34
34 -
 35
35 -
 36
36 -
 37
37 -
 38
38 -
 39
39 -
 40
40 -
 41
41 -
 42
42 -
 43
43 -
 44
44 -
 45
45 -
 46
46 -
 47
47 -
 48
48 -
 49
49 -
50
-
51
-
52
-
53
-
54
-
55
-
56
-
57
-
58
-
59
-
60
-
61
-
62
-
63
-
64
-
65
-
66
-
67
-
68
-
69
-
70
-
71
-
72
-
73
-
74
-
75
-
76
-
77
-
78
-
79
-
80
-
81
-
82
-
83
-
84
-
85
-
86
-
87
-
88
-
89
-
90
-
91
-
92
-
93
-
94
-
95
-
96
-
97
-
98
-
99
-
100
-
101
-
102
-
103
-
104
-
105
-
106
-
107
-
108
-
109
-
110
-
111
-
112
-
113
-
114
-
115
-
116
-
117
-
118
-
119
-
120
-
121
-
122
-
123
-
124
-
125
-
126
-
127
-
128
-
129
-
130
-
131
-
132
-
133
-
134
-
135
-
136
 |
 |

36
the highest risk in our $84.2 billion Home Equity portfolio.
The loans in the liquidating portfolio were primarily sourced
through wholesale (brokers) and correspondents. Additionally,
they are largely concentrated in geographic markets that have
experienced the most abrupt and steepest declines in housing
prices. We will continue to provide home equity financing
directly to our customers, but have stopped originating or
acquiring new home equity loans through indirect channels
unless they are behind a Wells Fargo first mortgage and have
a combined loan-to-value ratio lower than 90%. We also
experienced increased net charge-offs in our unsecured con-
sumer portfolios, such as credit cards and lines of credit, in
part due to growth and in part due to increased economic
stress in households.
Full year 2007 auto portfolio net charge-offs were $1.02 billion
(3.45% of average loans), compared with $857 million (3.15%)
in 2006. These results were consistent with our expectations
and reflected planned lower growth in originations and an
improvement in collection activities within this business.
The provision for credit losses was $4.94 billion in 2007,
an increase of $2.74 billion from $2.20 billion in 2006, due
to higher net charge-offs and the 2007 credit reserve build
of $1.4 billion, primarily for higher net loss content that we
estimated in the Home Equity portfolio. Given the weakness
in housing and the overall state of the U.S. economy, it is
likely that net charge-offs will be higher in 2008. The allowance
for credit losses, which consists of the allowance for loan
losses and the reserve for unfunded credit commitments, was
$5.52 billion (1.44% of total loans) at December 31, 2007,
compared with $3.96 billion (1.24%) at December 31, 2006.
At December 31, 2007, total nonaccrual loans were
$2.68 billion (0.70% of total loans) up from $1.67 billion
(0.52%) at December 31, 2006. The majority of the increase
in nonaccrual loans was concentrated in the first mortgage
portfolio ($209 million in Wells Fargo Home Mortgage and
$343 million in Wells Fargo Financial) and was due to the
national rise in mortgage default rates. We believe there is
minimal additional loss content in these loans since they are
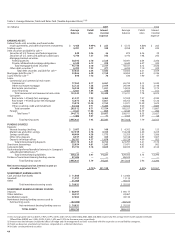
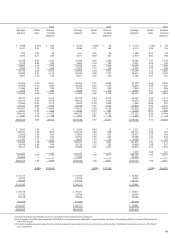
Table 1: Six-Year Summary of Selected Financial Data
(in millions, except 2007 2006 (1) 2005 2004 2003 2002 % Change Five-year
per share amounts) 2007/ compound
2006 growth rate
INCOME STATEMENT
Net interest income $ 20,974 $ 19,951 $ 18,504 $ 17,150 $ 16,007 $ 14,482 5% 8%
Noninterest income 18,416 15,740 14,445 12,909 12,382 10,767 17 11
Revenue 39,390 35,691 32,949 30,059 28,389 25,249 10 9
Provision for credit losses 4,939 2,204 2,383 1,717 1,722 1,684 124 24
Noninterest expense 22,824 20,837 19,018 17,573 17,190 14,711 10 9
Before effect of change in
accounting principle (2)
Net income $ 8,057 $ 8,420 $ 7,671 $ 7,014 $ 6,202 $ 5,710 (4) 7
Earnings per common share 2.41 2.50 2.27 2.07 1.84 1.68 (4) 7
Diluted earnings
per common share 2.38 2.47 2.25 2.05 1.83 1.66 (4) 7
After effect of change in
accounting principle
Net income $ 8,057 $ 8,420 $ 7,671 $ 7,014 $ 6,202 $ 5,434 (4) 8
Earnings per common share 2.41 2.50 2.27 2.07 1.84 1.60 (4) 9
Diluted earnings
per common share 2.38 2.47 2.25 2.05 1.83 1.58 (4) 9
Dividends declared
per common share 1.18 1.08 1.00 0.93 0.75 0.55 916
BALANCE SHEET
(at year end)
Securities available for sale $ 72,951 $ 42,629 $ 41,834 $ 33,717 $ 32,953 $ 27,947 71 21
Loans 382,195 319,116 310,837 287,586 253,073 192,478 20 15
Allowance for loan losses 5,307 3,764 3,871 3,762 3,891 3,819 41 7
Goodwill 13,106 11,275 10,787 10,681 10,371 9,753 16 6
Assets 575,442 481,996 481,741 427,849 387,798 349,197 19 11
Core deposits (3) 311,731 288,068 253,341 229,703 211,271 198,234 89
Long-term debt 99,393 87,145 79,668 73,580 63,642 47,320 14 16
Guaranteed preferred beneficial
interests in Company’s
subordinated debentures (4) —————2,885——
Stockholders’ equity 47,628 45,814 40,660 37,866 34,469 30,319 49
(1) Results for 2006 have been revised to reflect $95 million of litigation expenses associated with indemnification obligations arising from the Company’s ownership interest
in Visa.
(2) Change in accounting principle is for a transitional goodwill impairment charge recorded in 2002 upon adoption of FAS 142, Goodwill and Other Intangible Assets.
(3) Core deposits are noninterest-bearing deposits, interest-bearing checking, savings certificates, market rate and other savings, and certain foreign deposits (Eurodollar
sweep balances).
(4) At December 31, 2003, upon adoption of FIN 46 (revised December 2003), Consolidation of Variable Interest Entities (FIN 46(R)), these balances were reflected in long-term
debt. See Note 14 (Long-Term Debt) to Financial Statements for more information.